While it’s still very early, there’s at least a chance that the 2024 presidential election could look a lot like the 2020 presidential election. President Joe Biden recently confirmed that he’s seeking a second term, and his predecessor and 2020 opponent, former President Donald Trump, already had launched his campaign to reclaim the White House.
For several decades now, neither major political party has been keen on giving unsuccessful nominees a second bite of the apple. The last time that happened was in 1968, when Republicans chose Richard Nixon, who had lost to John F. Kennedy in 1960.
But that hasn’t always been the case. Should a Biden-Trump sequel come about, it would be the seventh presidential rematch in U.S. history, and the first since the 1950s. In the first four rematches, the outcome was different the second time around; in the most recent two, the outcomes were the same as the first match-up.
Here’s a look at the presidential rematches the country has experienced so far, and the varying political contexts in which they came about:
The country’s first actively contested presidential elections proved conclusively that the Constitution’s elaborate mechanism for electing presidents wouldn’t work once parties were added to the mix.
Originally, each presidential elector cast two ballots, with the candidate receiving the most becoming president and the runner-up becoming vice president. This worked fine the first two elections, when George Washington and John Adams were the clear favorites. But in 1796, when the Federalist Party backed Adams for the presidency and the Democratic-Republican Party supported Thomas Jefferson, the system’s flaws quickly became apparent.
In order to elect their preferred pair as president and vice president, both parties tried to arrange for a few of their electors to either cast only one ballot or vote for someone other than their party’s intended running mate (Thomas Pinckney for the Federalists, Aaron Burr for the Democratic-Republicans). In theory, that would ensure that the intended two men came out on top and in the right order. In practice, in an era of slow communications over great distances, such plans would have been difficult to pull off even if the parties were united and firmly disciplined.
Which they weren’t. Neither the Federalists nor the Democratic-Republicans were fully sold on their respective tickets. (Alexander Hamilton, for one, worked secretly to get some Federalist electors from Southern states to withhold their votes for Adams, in hopes of boosting Pinckney into the top spot – a ploy which backfired when New England Federalists found out about it and refused to cast ballots for Pinckney.) And the electors were free to disregard their party’s “official” picks and cast their two votes however they wished, so long as one went to someone from a state other than their own.
The end result was, as historian Gordon Wood called it, “a confused and chaotic affair.” Although records are incomplete, at least nine electors voted for Jefferson and Pinckney. One voted for Adams and Jefferson. Two cast votes for Washington, who had made it clear he didn’t want the job any longer. In all, 13 men received at least one electoral vote. Adams squeaked out a win, but Jefferson came in second and took the vice presidency.
Adams and Jefferson faced each other again in 1800, and the results were almost as chaotic. This time Jefferson and Burr defeated Adams’ ticket, but because all their electors voted for both of them (rather than a few abstaining or voting for someone else), they tied for first place. That meant the outgoing House of Representatives – still controlled by Federalists, whose candidates had lost the election – got to decide whether Jefferson or Burr would be the next president. The House deadlocked for a week and slogged through 35 ballots before finally choosing Jefferson on the 36th. Before the next election, the 12th Amendment was ratified to require separate balloting for president and vice president – and, it was hoped, to prevent this sort of thing from happening again.
John Quincy Adams vs. Andrew Jackson, 1824 and 1828
But the new system wasn’t foolproof either, as the four-sided election of 1824 demonstrated. By that time the Democratic-Republicans, who’d won every election since 1800 and driven the Federalists into near-oblivion, had splintered into rival factions. No fewer than five prominent public figures sought the presidency in 1824: Secretary of State John Quincy Adams, former Gen. Andrew Jackson, House Speaker Henry Clay, Treasury Secretary William H. Crawford and Secretary of War John C. Calhoun (though he eventually decided to stand for vice president instead). When the dust settled, no one had come close to winning a majority of either the popular or electoral votes.
That sent the election to the House again, which had to choose from among the top three vote-getters. Clay, who had been eliminated, used his influence to swing the vote in Adams’ favor; soon after, Adams appointed Clay as secretary of state. That in turn touched off furious charges by Jackson and his supporters that the two men had conspired in a “corrupt bargain” and effectively launched Jackson’s 1828 campaign.
Jacksonians spent four years attacking Adams and building a new party, the Democrats, to take him on. In 1828, Jackson won clear popular- and electoral-vote victories, and he went on to serve two terms as president.
Van Buren, Jackson’s vice president and one of the main architects of the Democratic Party, ran for the top job himself in 1836. But opponents of the Jackson-Van Buren administration were coming together into a new national party: the Whig Party.
The Whigs were still a work in progress in 1836, and Van Buren ended up facing multiple “opposition” candidates who ran in different states. The most successful, retired Gen. William Henry Harrison, carried seven states and won 37% of the popular vote. Although Van Buren won the presidency, Harrison’s performance brought him renewed prominence.
By 1839, the Whigs were organized enough to hold a national convention, which nominated Harrison for the following year’s election. Van Buren’s popularity, meanwhile, had plunged due to the Panic of 1837 and the perception that he was an effete, out-of-touch aristocrat. After a campaign marked by such innovations as sloganeering, mass rallies, image-creation and what today we would call PR stunts, Harrison won the popular vote by 6 percentage points and beat Van Buren decisively in the Electoral College.
Grover Cleveland vs. Benjamin Harrison, 1888 and 1892
In 1884, Democrat Cleveland had broken the Republicans’ 24-year lock on the presidency and was widely praised as honest, thrifty and hardworking. But he was vulnerable, having alienated many important industries by advocating for lower tariffs. Republicans, who favored high “protective” tariffs, nominated Harrison, who had an impressive pedigree (as William Henry Harrison’s grandson), a Civil War record that made him popular with veterans (Cleveland had hired a substitute to serve in his place), and was from the swing state of Indiana. Even though Cleveland outpolled him in the popular vote, Harrison prevailed in the Electoral College.
As Cleveland left the White House, his wife reportedly told the staff to “take good care of all the furniture and ornaments in the house … for I want to find everything just as it is now when we come back again four years from today.” Although Cleveland stayed out of politics at first, by 1891 he was openly criticizing the Harrison administration and the Republican-controlled Congress for raising tariff rates and increasing the money supply by coining more silver dollars. The following year, Cleveland easily won renomination, defeated Harrison and, as Mrs. Cleveland had predicted, returned to the White House.
William McKinley vs. William Jennings Bryan, 1896 and 1900
Shortly after Cleveland’s reelection, the U.S. economy plunged into a deep depression. That, along with labor unrest and continuing agitation over monetary policy, turned Cleveland’s own party against him. In 1896, the Democrats turned to Bryan, a forceful opponent of the gold standard and advocate of the “free and unlimited coinage of silver,” which he claimed would aid debt-ridden farmers and working people by inflating the money supply.
The Republicans nominated Ohio Gov. William McKinley, a business-oriented conservative who favored high tariffs and the gold standard, which he called “sound money.” McKinley’s campaign raised unprecedented sums from big corporations and used it to forge a coalition of industrial workers and urban dwellers (especially immigrants) in the Northeast and Midwest.
Despite traveling thousands of miles and giving hundreds of speeches, Bryan came up short in both the popular and electoral votes. But he came close enough that he had no real opposition for the Democratic nomination in 1900, when he faced McKinley again.
By then the free-silver issue had receded somewhat, while questions of American imperialism (exemplified by the Spanish-American War and the annexation of Hawaii) came more to the fore. But with the war over and the U.S. economy booming, McKinley won a slightly higher share of the popular vote than he had in 1896, and flipped six states that Bryan had carried four years earlier (while Bryan flipped only one).
Eisenhower, who had led the Allied armies to victory in Europe during World War II, was so popular that both major parties spawned “Draft Eisenhower” movements. Eisenhower eventually declared himself a Republican and won a closely contested battle for the GOP nomination. The Democrats, who had no obvious front-runner after then-President Harry Truman took himself out of the race, eventually nominated Illinois Gov. Adlai Stevenson.
Eisenhower, though a political newcomer, proved to be a formidable campaigner, attacking the Democrats over “Korea, Communism and corruption.” He ended up taking 55% of the popular vote in 1952, winning all but nine states.
Four years later, with the Korean War over and the U.S. economy booming, Eisenhower faced no opposition within his party for another term. Stevenson, however, had to fend off several challengers before securing his renomination. For all that, Stevenson had even less success against Eisenhower his second time around: The incumbent president rolled to victory with 57% of the popular vote and the electoral votes of all but seven states.
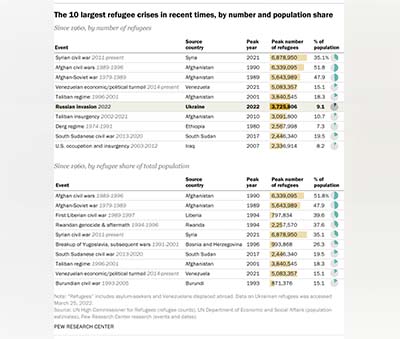 The Center examined all cases in the UNHCR’s database since 1960 where there were at least 500,000 refugees and similarly displaced people from a given country in a given year. The analysis doesn’t include “internally displaced persons” – those who have fled or been forced from their usual homes but haven’t yet crossed an international border. (Earlier this week, UNHCR head Filippo Grandi estimated that, all told,
 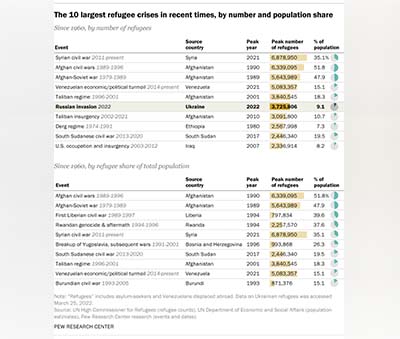 The Center examined all cases in the UNHCR’s database since 1960 where there were at least 500,000 refugees and similarly displaced people from a given country in a given year. The analysis doesn’t include “internally displaced persons” – those who have fled or been forced from their usual homes but haven’t yet crossed an international border. (Earlier this week, UNHCR head Filippo Grandi estimated that, all told,
  Afghanistan, which has been at war either with itself or with outside forces for more than four decades, has had more than 2 million refugees every year since 1981. The peak year was 1990, after Soviet troops had withdrawn from the country and the USSR-backed government was battling to hang onto power against a coalition of mujahedeen groups. That year, more than half the country’s total estimated population – 6.3 million people – were listed as refugees.
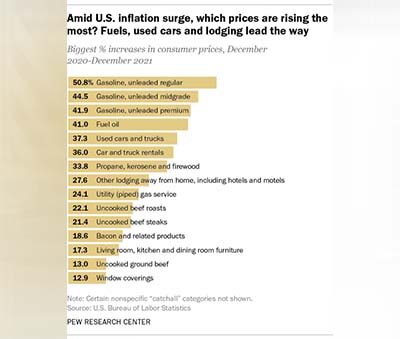
 The Bureau of Labor Statistics (BLS), which is responsible for the CPI, starts by collecting price data for hundreds of discrete goods and services – the so-called “market basket” – from around 8,000 housing units and 23,000 retailers, service providers and online outlets in 75 urban areas around the country. Data on rents is gathered from some 50,000 landlords and tenants. The items sampled, and their weights in the overall index, are determined by the