
As the United States prepares for a winter significantly influenced by the first substantial El Niño event in several years, scientists from the National Oceanic and Atmospheric Administration (NOAA) have unveiled maps providing insights into potential snowfall patterns.
El Niño, a natural oceanic and atmospheric phenomenon in the tropical Pacific, is predicted to reach its most potent level since a very strong El Niño in 2015-2016, which led to the warmest winter ever recorded in the contiguous US, according to NOAA.
While no two El Niño winters are identical, the typical outcome involves wetter and cooler weather in the southern US, while the northern regions become drier and warmer. This is precisely what is anticipated for the upcoming winter.
However, it’s crucial to note that wetter weather doesn’t necessarily equate to more snow. Furthermore, when snow does fall, the amounts can vary significantly from one location to another.
The newly released maps provide information on where snow is more or less likely during El Niño winters compared to the average. However, it’s essential to understand that these maps are historical guidelines, not actual forecasts. Snowfall forecasts consider various atmospheric and climatological factors, not just El Niño.
“El Niño nudges the odds in favor of certain climate outcomes, but never ensures them,” clarified Michelle L’Heureux, one of the scientists responsible for the maps, in a NOAA blog post.
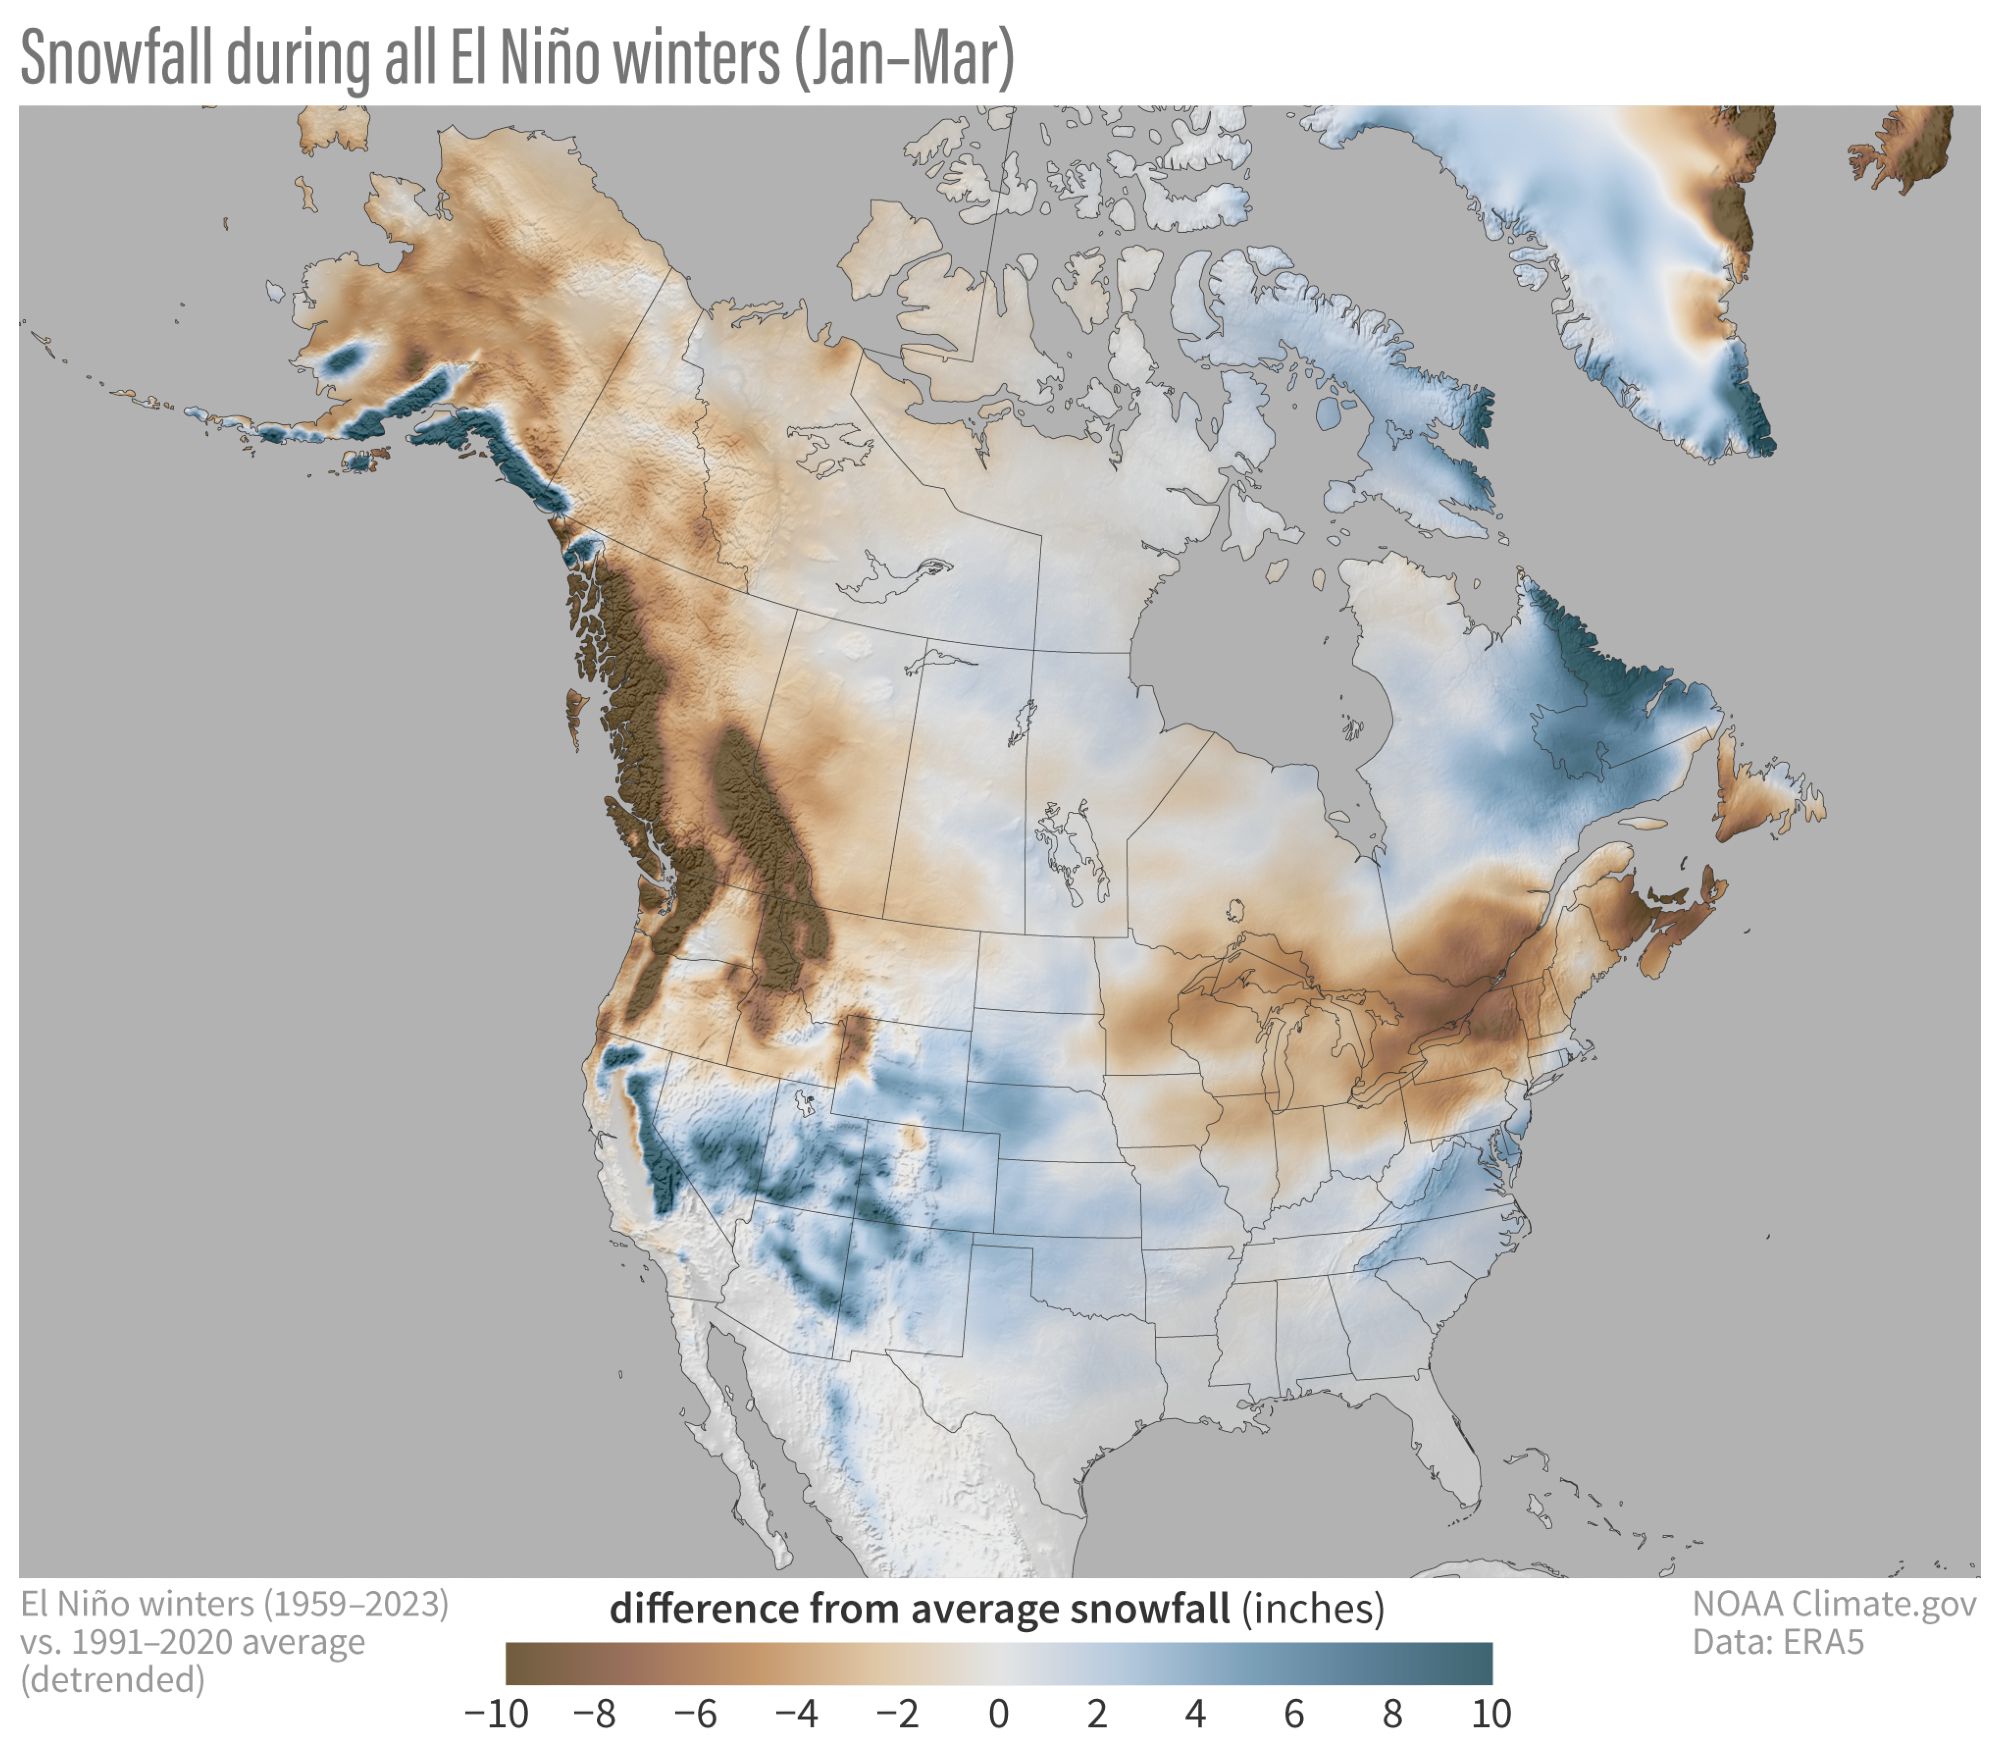
The first map illustrates the differences in snowfall from the average during all El Niño winters, regardless of the strength of El Niño. The tan and brown shading highlights the drier trend typically observed in the northern US, while the blue shading indicates the wetter and snowier trend in the southern US. This trend is attributed to the southward shift of the jet stream, which directs storms across the southern part of the country, increasing the likelihood of snow.
The impact of El Niño becomes more pronounced as its strength increases. The next map shows the same data for stronger El Niño winters. The darker hues represent more significant deviations in snowfall during strong El Niño events compared to average ones.
The regions that benefit most from increased snowfall during strong El Niño events include the mid-Atlantic, high elevations in the Southwest and California, and the southern US, with a noteworthy caveat. To witness snow, the temperatures must be low, so the chances of snow don’t vary significantly from normal in areas of Texas and the Southeast, where temperatures tend to remain too warm for snowfall.
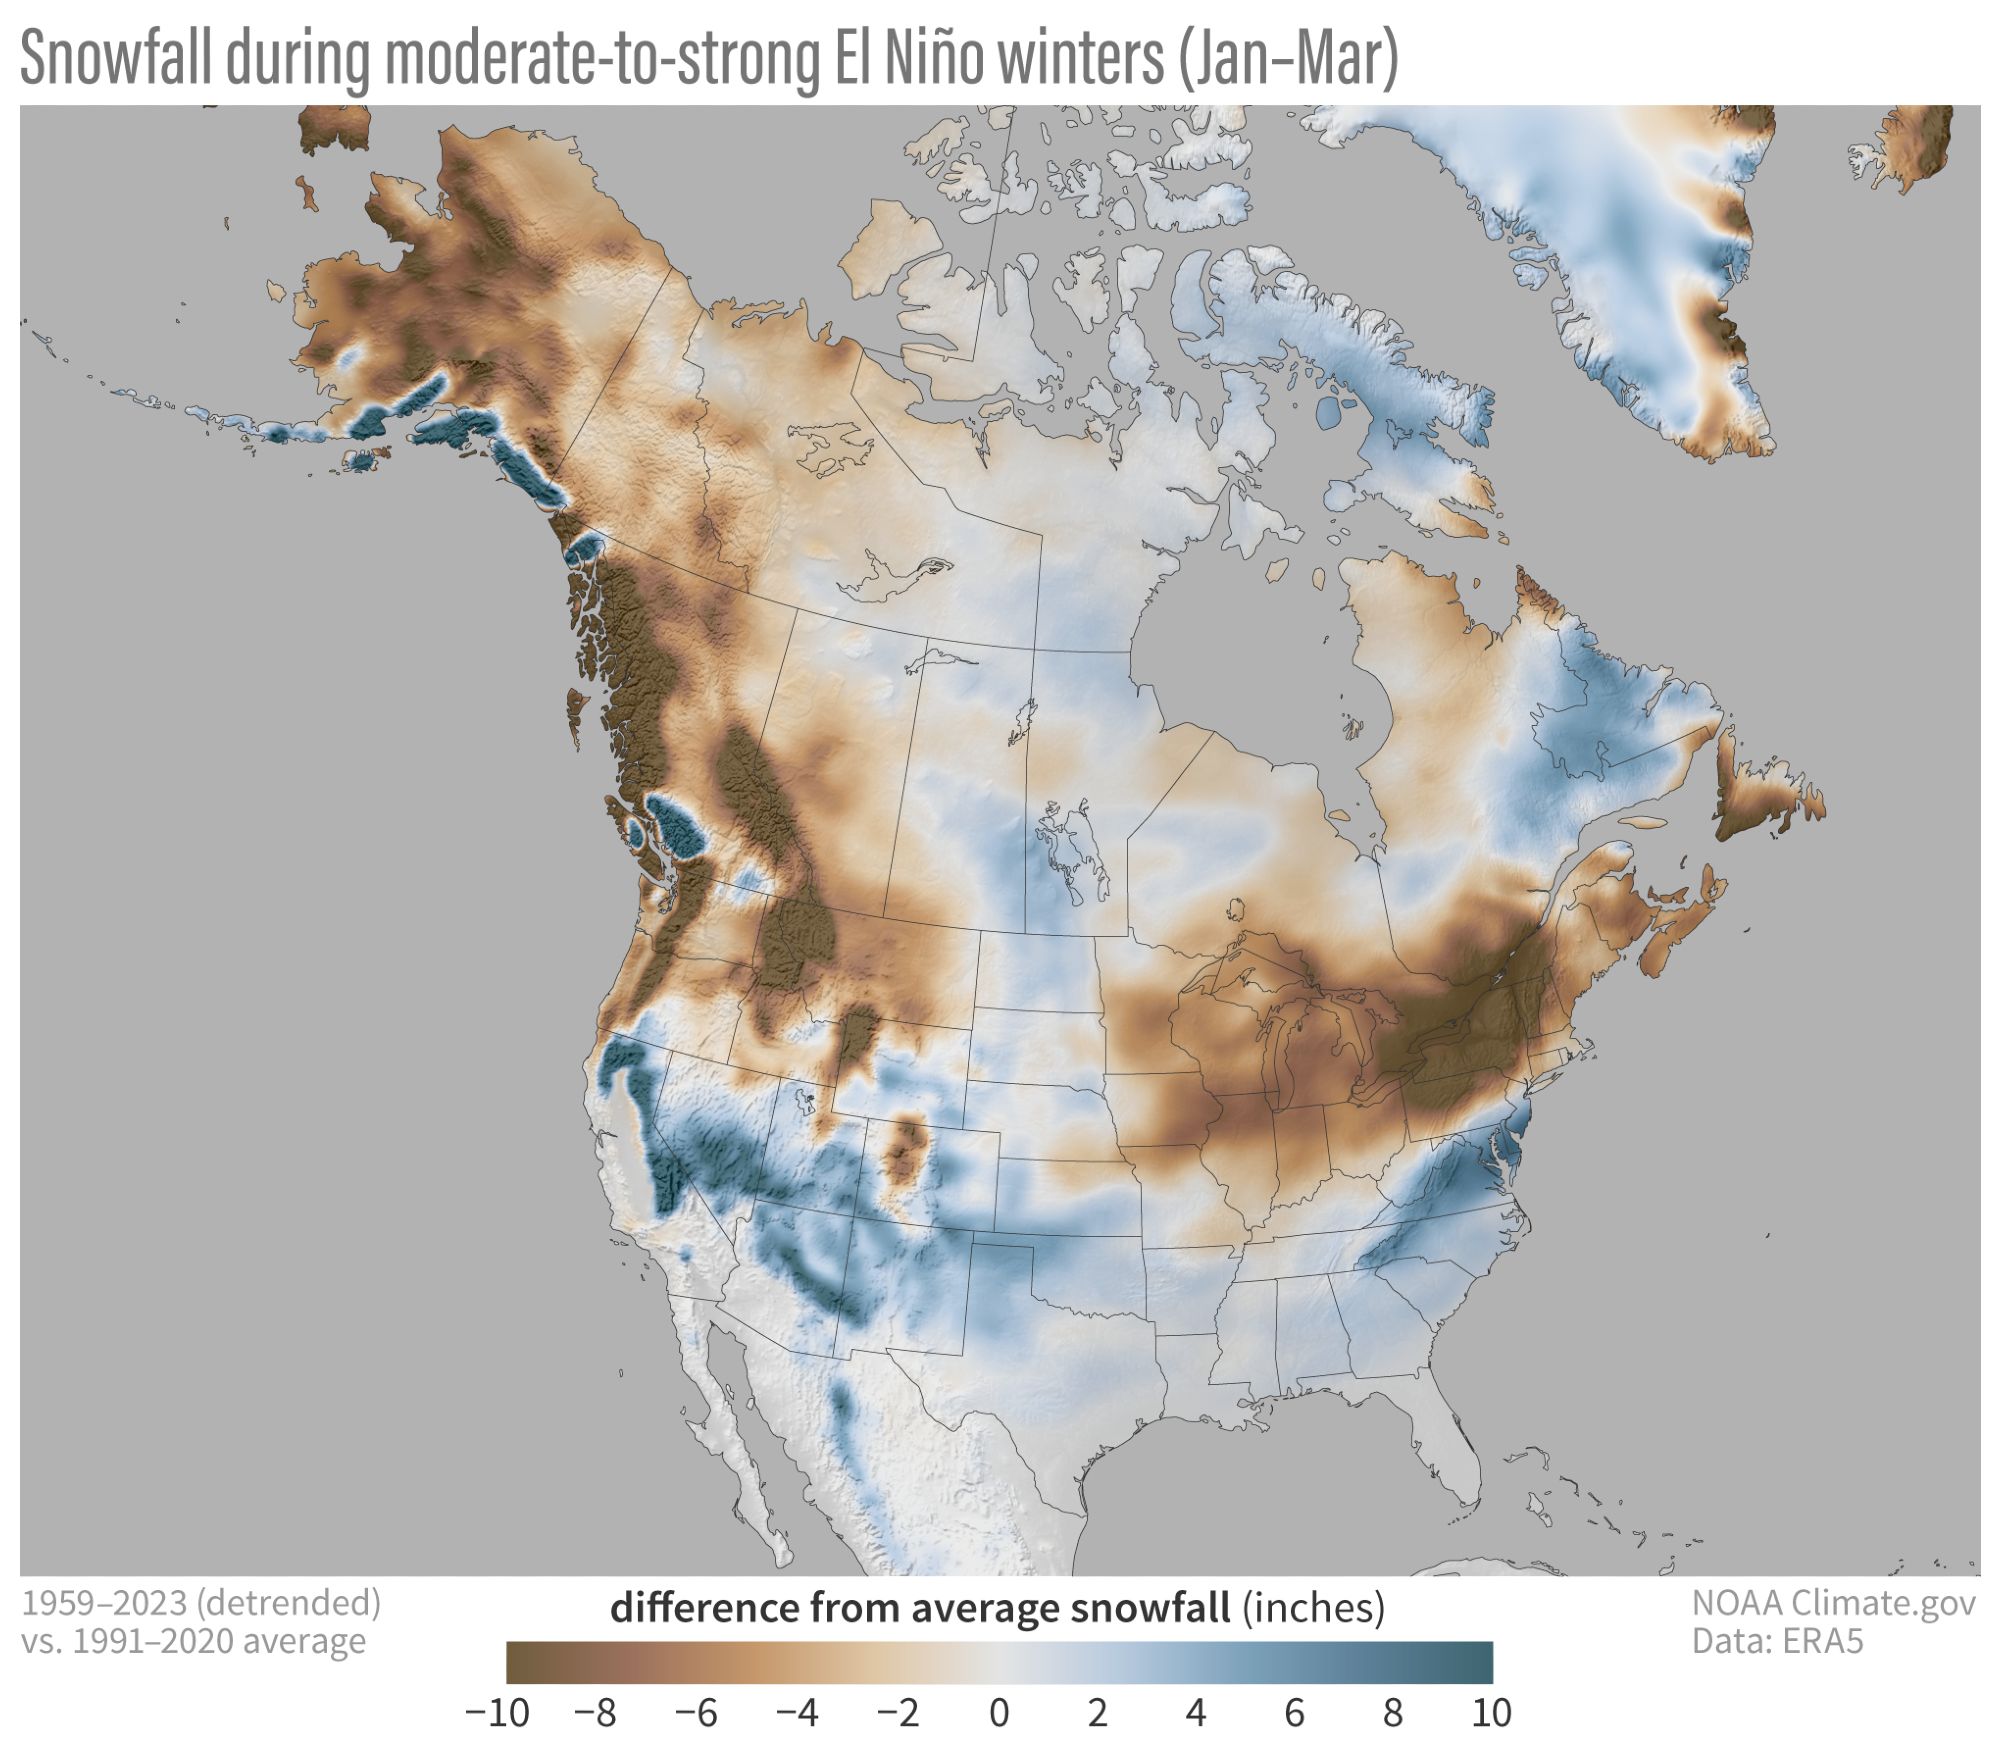
The influence of El Niño’s jet stream effect is particularly evident in the high terrain of the West, where cold and snowy conditions are common. Mountains in the Southwest and California experience more snow, while the Northwest sees fewer storms.
Storms that impact the mid-Atlantic’s snowfall prospects typically follow a path along the Appalachian Mountains or move off the coast to become nor’easters. During El Niño events, these nor’easters can be enhanced by abundant tropical moisture and deliver an average of “two to three significant snowstorms,” according to Jon Gottschalck, chief of the Operational Prediction Branch at NOAA’s Climate Prediction Center.
This could lead to above-average snowfall in places like Washington, DC, and Baltimore, which received less than an inch of snow last winter.
Although the Northeast typically sees less snow during strong El Niño winters, a single massive storm, such as a potent nor’easter, can skew the snowfall totals for the entire season.
Snow enthusiasts in the Northwest and Midwest will also need to rely on substantial storms for significant snowfall, as stronger El Niño events have historically resulted in less snow than average.
By removing snowfall totals from the map and focusing on the number of strong El Niño events with below-average snowfall, it becomes apparent which areas are most often affected by snow deficits. Darker red areas on the map indicate regions that have experienced more years of below-average snowfall during moderate-to-strong El Niño winters, including parts of the typically snowy Midwest and Northeast. This suggests that these areas are most susceptible to having their snowfall “stolen” by El Niño.