
Dr. ManMohan Singh became Prime Minister on 22 May 2004, and he remained in office until 26 May 2014. After that Narendra Modi government has been continuously in power. This article dwells into how both governments faired on controlling inflation in India. We first took the CPI (Consumer Price Index) published by Government of India as a measure of inflation. However, this index represents just a fraction (includes only the goods that consumers consumed) of the total economic activity and ignores the substitution effect that arises from price changes. To have a comprehensive measure of inflation for the economy as a whole and incorporating the substitution effect on net inflation we calculated GDP Deflator where inflation is measured by (GDP at Current prices / GDP at constant prices) -1 and converted into percentage. Finally, we tried to verify the accuracy/consistency of inflation data published by Government of India with the international monetary theory which predicts long run inflation differentials between two countries. For this we used US dollar as the base currency and compared depreciation of rupee as the differential inflation.
 This differential inflation between two countries talks about inflation of traded goods and investible assets including stocks and bonds. It also indicates how international investors perceive the overall health of the Indian economy i.e. if they see low inflation of a period as the strength of the economy or the weakness of the economy. Remember during recession, inflation is low and during deflation inflation is negative, and both the situations are undesirable. The third situation is that of stagflation when real GDP stagnates or declines like we have since Indian Lockdown on account of Covid, while nominal GDP and stock market booms.
Taking historical data from the Economic Survey of India and trading economics for the recent months, we found that during the era of UPA Government (from May 22, 2004m to May 26 2014) headed by Dr. ManMohan Singh, inflation for the entire ten years was 8.48% per annum as per CPI measure, while as per GDP deflator it was 6.81% and as per US inflation differential it was 2.84% and since US inflation has been around 2%, this tells Indian inflation has been around 5% (2.84+2) for traded goods and investible assets. These figures look consistent.
However, Modi government has completed only 7 years, hence it would be fair to compare the inflation figures for the first 7 years of UPA government. During that period (May 2004 Until May 2011), as per CPI measure the annual average inflation rate had been 7.57%, as per GDP Deflator it had been 6.81% and as per US inflation differential it had been negative 0.17%. Rupee actually became stronger vs. US dollar. On 28th May, 2004, the exchange rate was $1 = 45.29 rupees and on May 26, 2011 this rate was $1= 44.75. These exchange rate figures were not much different from average values of the month. This means international investors saw Indian domestic inflation as a mark of strength and demanded more rupee for investments in India because trade deficit and total current account deficit was still there. Huge foreign investments in India (surplus on capital account) made rupee stronger and boosted foreign exchange reserves.
Compared to this, we now see the inflation scenario during NDA (Modi Government) era. As per CPI measure, inflation has remained lower at 5.11% while it was 7.57% under UPA. We then we compare the GDP deflator figures, which we find from our calculation to be equal to 3.19%. The main reason for this low inflation for the entire seven years was the period of demonetization as during the demonetization period, the inflation rate was very low, just 1% during 2016 and 2.8% during 2017. Since this inflation rate was slightly lower than US inflation rate of 2% for the entire two years, rupee became slightly stronger. The principles of economics are working. But after March 2018, the weakness of lower inflation became visible to international investors and rupee sharply depreciated.
On March 31st, 2018, the exchange rate was $1 = 65.01 and within one year it depreciated to 69.30 (a depreciation by 6.6%) giving international inflation figure of 8.6% (6.6+2% US inflation) for the year 2018-19. For the overall seven-year period until May 26, 2021, relative international inflation rate of India has been 3.14% seen by depreciation of rupee measure. This is sharply worse when compared with the relative international inflation figure of (-0.17%) of UPA government for their first seven years. This means that foreigners are either seeing low inflation of India as a weakness of the Indian economy or they are simply not believing the Indian inflation data, otherwise rupee would not have depreciated against dollar. According to International Investors, inflation in India for traded goods and investments should be 3.14%+2% = 5.14% while for Dr. ManMohan Singh’s first seven years period, this figure was just 1.83% (-0.17+2%).
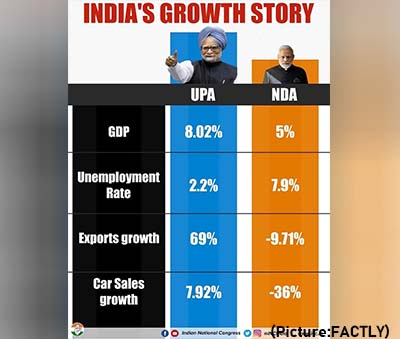
To conclude, we can say that Dr.Manmohan Singh has performed far better in tacking inflation and having a better economic performance when compared to Narender Modi Government. The inflation number achieved by Modi government has been because of negative growth of entire GDP by 9.2% since pandemic, otherwise the performance of Modi Government would have been visibly more worse. People have become so poor that they don’t have enough purchasing power to buy goods. Manufacturing, trade, transport, communication and social-person services all have been in decline. Modi government has failed tremendrously in tacking Inflation when compared with UPA government domestically.
Internationally also, Dr. Manmohan Singh Government had performed much better when compared to the Modi Government in attracting economic investments. Even though the Modi Government has altered the domestic calculation index for GDP and Inflation to show a better picture, international figures are completely reliable as they can not be manipulated by the domestic governments since exchange rates are traded daily. India has seen better economic performance and perception during the Manmohan Singh Government in almost all aspects when compared to the Modi Government.
Sources:
- https://www.indiabudget.gov.in/economicsurvey/doc/Statistical-Appendix-in-English.pdf
- https://tradingeconomics.com/india/inflation-cpi
- https://www.google.com/search?q=exchange+rate+dollar+to+rupee&rlz=1C1CHBF_enUS834US834&sxsrf=AOaemvJLApHUnQXmNy2x8hIJKIVq464nYg%3A1631641979141&ei=e-FAYcrwB4jm_QaBobLwDQ&oq=exchange+rate+dollar&gs_lcp=Cgdnd3Mtd2l6EAEYATIFCAAQgAQyCwgAEIAEELEDEIMBMgoIABCABBCHAhAUMgoIABCABBCHAhAUMgUIABCABDIGCAAQBxAeMgUIABCABDIFCAAQgAQyBQgAEIAEMgUIABCABDoHCAAQRxCwAzoHCCMQsAIQJzoICAAQCBAHEB46BggAEAgQHjoECAAQDToJCAAQDRBGEIICSgQIQRgAUIv4AljokQNguLADaAFwAngAgAG2AYgBsQ6SAQQxLjEymAEAoAEByAEIwAEB&sclient=gws-wiz