
The time has come for India to raise its poverty line from the existing extreme poverty line of $1.90 per person per day to the lower-middle income (LMI) poverty line of $3.20, a level some 68 percent higher. This may seem odd to aspire to in what is not even the first post-pandemic year, but that is the main message coming out of our recent IMF working paper “Pandemic, Poverty and Inequality: Evidence from India.”
No one should be surprised at this need for a higher poverty line. Per capita GDP growth in India averaged 3.5 percent per annum for twenty years from 1983 to 2003. In 2004, the official poverty line was raised by 18 percent, when the head count ratio (HCR) was 27.5 percent. Rapid growth (5.3 percent per annum) and an improved method of measurement of consumption (the modified mixed recall period (MMRP) rather than the Uniform Recall Period (URP)), resulted in the HCR reaching the low teens in 2011-12.
The poverty line should have been raised then, as Bhalla (2010) argued. Most countries change from the concept of absolute poverty to relative poverty as they get richer, and India should too. Relative poverty—subject to minor debate—is mostly chosen to mean an HCR level of around a quarter or a third of the population. Hence, the$1.90 poverty line was already too low in 2011-12 and is extremely low today.
The HCR of the $1.90 poverty line (Figure 1) has shown a steep decline since 2004—from approximately a third of the population in 2004 to less than 1.5 percent in 2019. These numbers are lower than those shown in the World Bank’s Povcal database, the most commonly used source, because Povcal does not correct for the misleading uniform recall period used or for the provision of food subsidies.
Figure 1. The poverty rate in India steeply declined starting in 2004
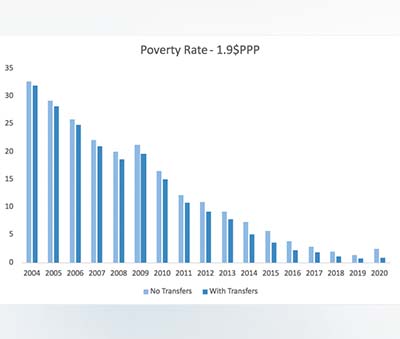 Source: NSS 2011-12 MMRP data; Private Final Consumption Expenditure (PFCE) growth rates for estimates of monthly per capita consumption; authors’ calculations.
By our estimates, in the pre-pandemic year 2019, extreme poverty was already below 1 percent and despite the significant economic recession in India in 2020, we believe that the impact on poverty was small. This is because we estimate poverty (HCR) after incorporating the benefits of in-kind food (wheat and rice) subsidies for approximately 800 million individuals (75 percent of rural and 50 percent of urban residents). This food subsidy was not small and rose to close to 14 percent of the poverty line for the average subsidy recipient (Figure 2) in 2020. This was enough to contain any rise in poverty even in the pandemic year 2020.
Figure 2. Food subsidies contained any increases in poverty
Source: NSS 2011-12 MMRP data; Private Final Consumption Expenditure (PFCE) growth rates for estimates of monthly per capita consumption; Indian poverty line very close to PPP $1.9 per capita per month; authors’ calculations.
A notable feature of the pandemic response was the provision of a free extra 5 kilograms of wheat or rice per person per month via the Pradhan Mantri Garib Kalyan Yojana (PMGKY) program plus 1 kg of pulses. This was in addition to the existing food transfers of 5 kg per capita per month of wheat or rice at subsidized prices. Total subsidized food grain in 2020 therefore amounted to 10 kg, which is the average per capita level of food (wheat and rice) consumption by Indian citizens for the last three decades.
The additional food subsidy was a pandemic-centric response. We would conjecture that a cross-country comparative study could show that this policy response was possibly the most effective in the world. Hence, the Indian experience can provide lessons for individual countries, and multilateral agencies concerned with effective redistribution of income.
Poverty measurement) in India was in 2011-12. The following survey conducted in 2017-18 generated results that have not been officially released, on the grounds that the data were not of acceptable quality. Our paper has an extensive discussion on the validity of the evidence regarding this controversial decision where we conclude that the data is indeed unreliable and of extremely questionable quality and hence should not be released. A very recent World Bank April 2022 study by Edochie et. al. suggests support for our conclusion and inference.
 Our paper presents a consistent time series of poverty and (real) inequality in India for each of the years 2004-2020. Our estimate of real inequality (Figure 3) shows that consumption inequality has also declined, and in 2020 is very close to the lowest historical level of 0.28. Poverty and inequality trends can be emotive, controversial, and confusing. Consumption inequality is lower than income inequality, which itself is lower than wealth inequality. And each can show different trends. The levels and trends are different, and intermingled use should carry a warning about this when discussing “inequality.”
Our results are different than most of the commentary and analysis of poverty in India. All the estimates are made in the absence of an official survey post-2011-12. A large part of the explanation for the difference in results is because of differences in definition. Our paper makes a strong case for the acceptance of the official consumption definition (accepted by most countries and also recommended by the World Bank); it should be measured according to the classification of consumption according to the nature of the good or service consumed. This is the MMRP method for obtaining consumption expenditures.
The Indian government has officially adopted this method, and the above mentioned “ill-fated” 2017-18 survey was the first time when the National Statistical Organization exclusively measured consumption (and poverty) according to the MMRP definition.
However, many studies continue to rely on the now obsolete uniform reference period (URP or 30-day recall for all items) method. For example, a very recent World Bank study estimated the HCR to be around 10 percent in 2019; it uses the outdated (URP) definition of consumption and does not adjust for food subsidies. Incidentally, both in 2009-10 and 2011-12, the URP and MMRP poverty estimates diverged by approximately 10 percentage points, as did their respective estimates of mean consumption.
Thus, given the approximate magnitude of definition differences observed both in 2009-10 and 2011-12 and making the necessary adjustment for food subsidies, the World Bank poverty estimate for 2019 is likely to be very close to our estimate.
Inclusive growth is a very relevant policy goal for all economies. With the pandemic ebbing and the IMF’s expected growth for India rebounding very strongly for three successive years from 2021-23, Indian policymakers will soon be confronted with a policy choice—how long should they keep the extra PMGKY subsidy? This query is part of a huge success story of poverty decline. Additionally, another query pertains to whether policies should move toward targeted cash transfers instead of subsidized food grains.
In the past, the key argument in support of a policy shift to cash transfers was to reduce leakages, but our results indicate that leakages have substantially been reduced over the last decade even in the in-kind food transfer scheme. In fact, the recent food transfer program was a very successful intervention, especially during the pandemic when supply chains were breaking down and there was heightened uncertainty. Under normal circumstances, cash transfers are likely to be more efficient, and they retain broadly the same allocative outcomes as food transfers. The debate therefore now should be on the efficiency trade-offs associated with use of either in-kind or cash transfers as the key instrument of poverty alleviation.
These debates are significant given the improvement in targeting of transfers and are consistent with the objective of building a modern social security architecture in developing countries.
Accumulating all the evidence, the strong conclusion from our work is that Indian policy has effectively delivered both growth and inclusion, and in a fundamental sense has faithfully followed the Rawlsian maximin principle—maximizing the welfare of the poorest.