
Today, over two thousand years ago Jesus Christ was persecuted or believed to be crucified on this day. Followers of Jesus are even today being persecuted in certain parts of the world including in India wherein vested groups of people are spreading hatred against minorities for their political gains.
| 2014 127 |
| 2015 142 |
| 2016 226 |
| 2017 248 |
| 2018 292 |
| 2019 328 |
| 2020 279 |
| 2021 502 |
| 2022 127
(till April 13) |
The persecution of Christians in India is intensifying which is leading to a systemic and carefully orchestrated violence against Christians, including use of social media to spread disinformation and stir up hatred.
The strong infiltration of hatred against Christians, have witnessed 127 incidents of violence in 2014 which increased to five hundred fold in 2021 as 502 incidents of violence was reported in 2021 on UCF toll-free helpline number 1800-208-4545.
Most church leaders are men, and being a pastor is understood to be one of the riskiest vocations in India. Pastors and their families are targeted to instill fear among them.
In the first 103 days of 2022 we have already witnessed 127 incidents of violence against Christians. January saw 40 incidents, 35 incidents in February, 34 incidents in March and just in 13 days of April 18 incidents of violence were reported on UCF helpline. In which 89 Pastors were beaten up and threatened from conducting prayers for which they became pastors. 68 Churches were attacked in which 367 women and 366 children received injuries. Out of 127 incidents 82 incidents were mob violence.
There are 42 cases pending in various courts challenging the constitutional validity of the so-called “Freedom of Religion Act against” which have been framed with a malafide intention to harass the Christian community who are falsely accused of forceful conversion. Whereas, till today, not a single Christian has been convicted for forcing any one to convert. Moreover, census after census have shown that Christian population remained 2.3 percent of India’s population of 1.2 billion.
There are many false cases that were filed against Christians which the courts have found untrue and pulled up the police and the authorities for misusing the poser. One example is in May 2017, 72 Christian children going for Christian camp from Madhya Pradesh to Nagpur accompanied by six elders were detained on charges of being “kidnapped to be converted’. The Madhya Pradesh High Court granting bail to children and elders directed the police to come back with evidence to prove their claim that children are not Christians and that they were being kidnapped to be converted. Till today, the police have not come back to Court.
In another judgement, beginning of 2019, the Delhi High Court while restoring the status of Overseas Citizen of India said that the government could not show any proof whatsoever of having forcefully or fraudulently converting even a single person. Under similar charges, there were over 40 Churches in Jaunpur District of Uttar Pradesh that were shut down in 2018. Even though pastors and other Christian leaders are out on bail, the police are yet to file the charge sheets against any of them as they do not have any evidence to prove fraud or forceful conversions. There are hundreds of such cases, if not in thousands, that are lying in front of various courts across India due to the absence of proof of fraud or forceful conversions.
The various courts in India in the last 15 months – January 2021 to March 2022 have acquitted Christians of false allegations of conversions in 59 cases (41 in 2021 and 18 till March 2022).
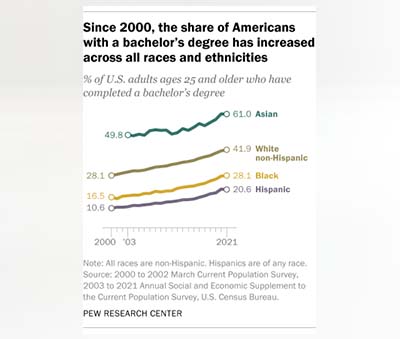
 There are racial and ethnic differences in college graduation patterns, as well as in the reasons for not completing a degree. Among adults ages 25 and older, 61% of Asian Americans have a bachelor’s degree or more education, along with 42% of White adults, 28% of Black adults and 21% of Hispanic adults, according to 2021 Current Population Survey data. The share of bachelor’s degree holders in each group has increased since 2010. That year, 52% of Asian Americans had a four-year degree or more, compared with a third of White adults, 20% of Black adults and 14% of Hispanic adults.
The October 2021 Center survey found that among adults without a bachelor’s degree, Hispanic adults (52%) were more likely than those who are White (39%) or Black (41%) to say a major reason they didn’t graduate from a four-year college is that they couldn’t afford it. Hispanic and Black adults were more likely than their White counterparts to say needing to work to support their family was a major reason.
While a third of White adults said not wanting to go to school was a major reason they didn’t complete a four-year degree, smaller shares of Black (22%) and Hispanic (23%) adults said the same. White adults were also more likely to cite not needing more education for the job or career they wanted. (There weren’t enough Asian adults without a bachelor’s degree in the sample to analyze separately.)
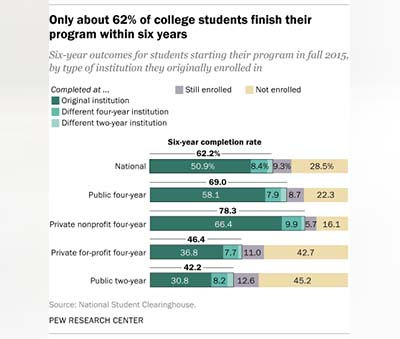
 Only 62% of students who start a degree or certificate program finish their program within six years, according to the most recent data from the National Student Clearinghouse, a nonprofit verification and research organization that tracked first-time college students who enrolled in fall 2015 with the intent of pursuing a degree or certificate. The degree completion rate for this group was highest among students who started at four-year, private, nonprofit schools (78.3%), and lowest among those who started at two-year public institutions (42.2%).
Business is the most commonly held bachelor’s degree, followed by health professions. According to the National Center for Education Statistics, about a fifth (19%) of the roughly 2 million bachelor’s degrees conferred in 2019-20 were in business. Health professions and related programs were the second most-popular field, making up 12.6% of degrees conferred that year. Business has been the single most common major since 1980-81; before that, education led the way.
The least common bachelor’s degrees in 2019-20 were in military technologies and applied sciences (1,156 degrees conferred in 2019-20), library science (118), and precision production (39).
There is a growing earnings gap between young college graduates and their counterparts without degrees. In 2021, full-time workers ages 22 to 27 who held a bachelor’s degree, but no further education, made a median annual wage of $52,000, compared with $30,000 for full-time workers of the same age with a high school diploma and no degree, according to data from the Bureau of Labor Statistics. This gap has widened over time. Young bachelor’s degree holders earned a median annual wage of $48,481 in 1990, compared with $35,257 for full-time workers ages 22 to 27 with a high school diploma.
 The unemployment rate is lower for college graduates than for workers without a bachelor’s degree, and that gap widened as a result of the coronavirus pandemic. In February 2020, just before the COVID-19 outbreak began in the U.S., only 1.9% of college graduates ages 25 and older were unemployed, compared with 3.1% of workers who completed some college but not a four-year degree, and 3.7% of workers with only a high school diploma. By June 2020, after the pandemic hit, 6.8% of college grads, 10.8% of workers with some college, and 12.2% of high school grads were unemployed.
By March 2022, the unemployment rate had nearly returned to pre-pandemic levels for college graduates (2%) while dropping to 3% among those with some college education but no four-year degree, and 4% among those with only a high school diploma.
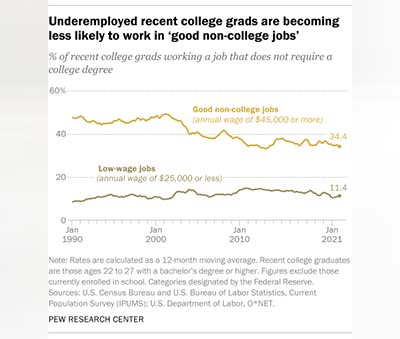
Recent college graduates are more likely than graduates overall to be underemployed – that is, working in jobs that typically do not require a college degree, according to an analysis of Census Bureau and BLS data by the Federal Reserve Bank of New York. As of December 2021, 41% of college graduates ages 22 to 27 were underemployed, compared with 34% among all college graduates. The underemployment rates for recent college grads rose in 2020 as the COVID-19 outbreak strained the job market, but have since returned to pre-pandemic levels.
As of the end of 2021, only 34% of underemployed graduates ages 22 to 27 worked what the Fed defines as “good non-college jobs” – those paying at least $45,000 a year – down from around half in the 1990s. The share of underemployed graduates ages 22 to 27 in low-wage jobs – those earning less than $25,000 annually – rose from about 9% in 1990 to 11% last year.
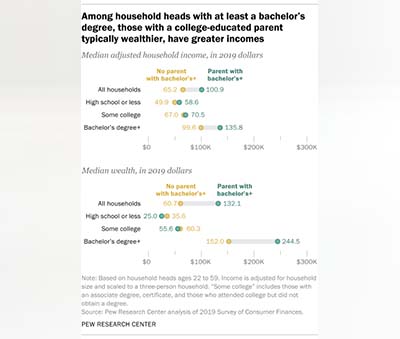
 When it comes to income and wealth accumulation, first-generation college graduates lag substantially behind those with college-educated parents, according to a May 2021 Pew Research Center analysis. Households headed by a first-generation college graduate – that is, someone who has completed at least a bachelor’s degree but does not have a parent with a college degree – had a median annual income of $99,600 in 2019, compared with $135,800 for households headed by those with at least one parent who graduated from college. The median wealth of households headed by first-generation college graduates ($152,000) also trailed that of households headed by someone with a parent who graduated from college ($244,500). The higher household income of the latter facilitates saving and wealth accumulation.
The gap also reflects differences in how individuals finance their education. Second-generation college graduates tend to come from more affluent families, while first-generation college graduates are more likely to incur education debt than those with a college-educated parent.
Most Americans with college degrees see value in their experience. In the Center’s October 2021 survey, majorities of graduates said their college education was extremely or very useful when it came to helping them grow personally and intellectually (79%), opening doors to job opportunities (70%) and developing specific skills and knowledge that could be used in the workplace (65%).
Younger college graduates were less likely than older ones to see value in their college education. For example, only a third of college graduates younger than 50 said their college experience was extremely useful in helping them develop skills and knowledge that could be used in the workplace. Among college graduates ages 50 and older, 45% said this.