Motivated By Abortion, Women Could Determine The Outcome In Midterm Elections

While both political parties have long coveted the women’s vote, for the most part in recent decades, it has helped Democrats. And in Tuesday’s midterm elections, this group will again be closely watched, as it will be especially affected by the Supreme Court’s overturning of Roe v. Wade, which effectively allows states to enact restrictive abortion provisions.

The fear among many pro-choice voters, particularly women, is that a Republican-dominated Congress could use this ruling as a premise to enact a nationwide abortion ban. A recent survey by the Kaiser Family Foundation shows that half or more of respondents are more motivated to vote in this year’s midterms because of abortion concerns, especially among women. And according to an Economist/YouGov poll conducted October 29 through November 1, 60% of women said that views on abortion mattered a lot in their voting, compared to 40% of men.

While polls indicate that women are more likely than men to favor Democrats in a national generic ballot for House of Representatives candidates, these do not reflect actual votes. They also do not show how those polling results apply to eligible voters. This analysis looks at both, using the most recent eligible voter populations compiled by the Census Bureau’s September 2022 Current Population Survey and applying to them voter turnout rates from the 2018 midterm and assumptions about 2022 voting. Through simulations, it shows how increased women’s turnout and voter preferences could impact national election results and specific battleground states. These simulations make clear that more pronounced turnout and Democratic voting preferences among women would benefit Democrats considerably.

WOMEN LEAN TOWARD DEMOCRATIC CANDIDATES, AND TURN OUT TO VOTE AT HIGHER RATES

In order to assess the role that women have in determining the midterm election results, it is important to view gender differences in both voting preferences and turnout. When examining national numbers, women overall have voted for Democrats over Republicans in every presidential and midterm election since 1982.[i]

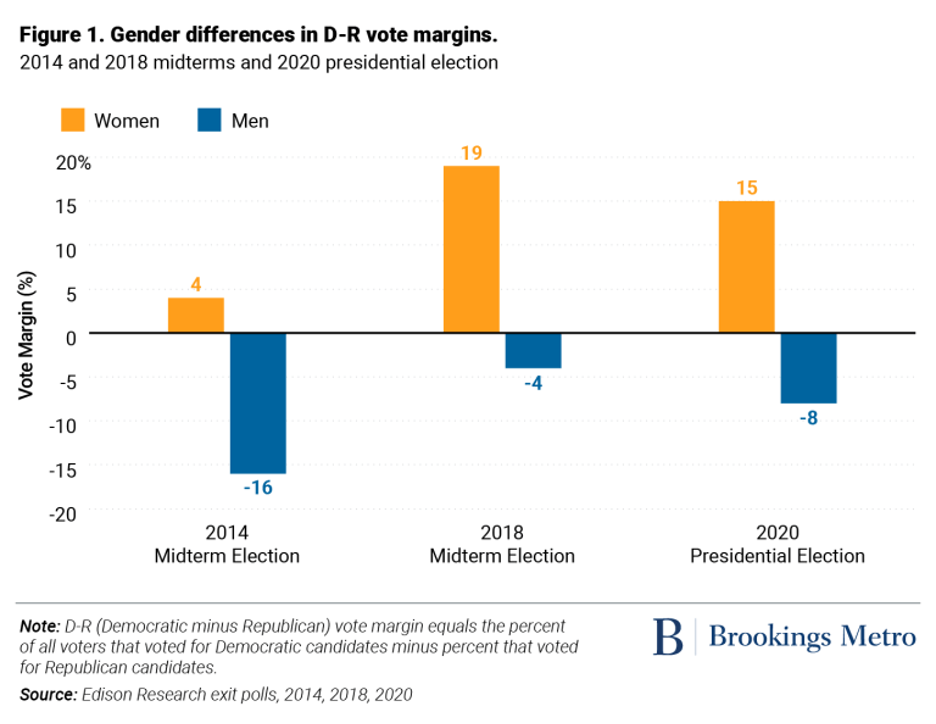
This is evident in Figure 1, which shows the D-R (Democratic minus Republican) vote margins by gender for national cumulative House of Representatives votes in 2014 and 2018 and for the 2020 presidential election. In each case, the D-R margins are positive for women and negative for men. The 2018 midterm election was a particularly strong year for Democrats, with women’s D-R margin far exceeding that for the 2014 midterms, while men’s negative D-R margin was noticeably smaller.

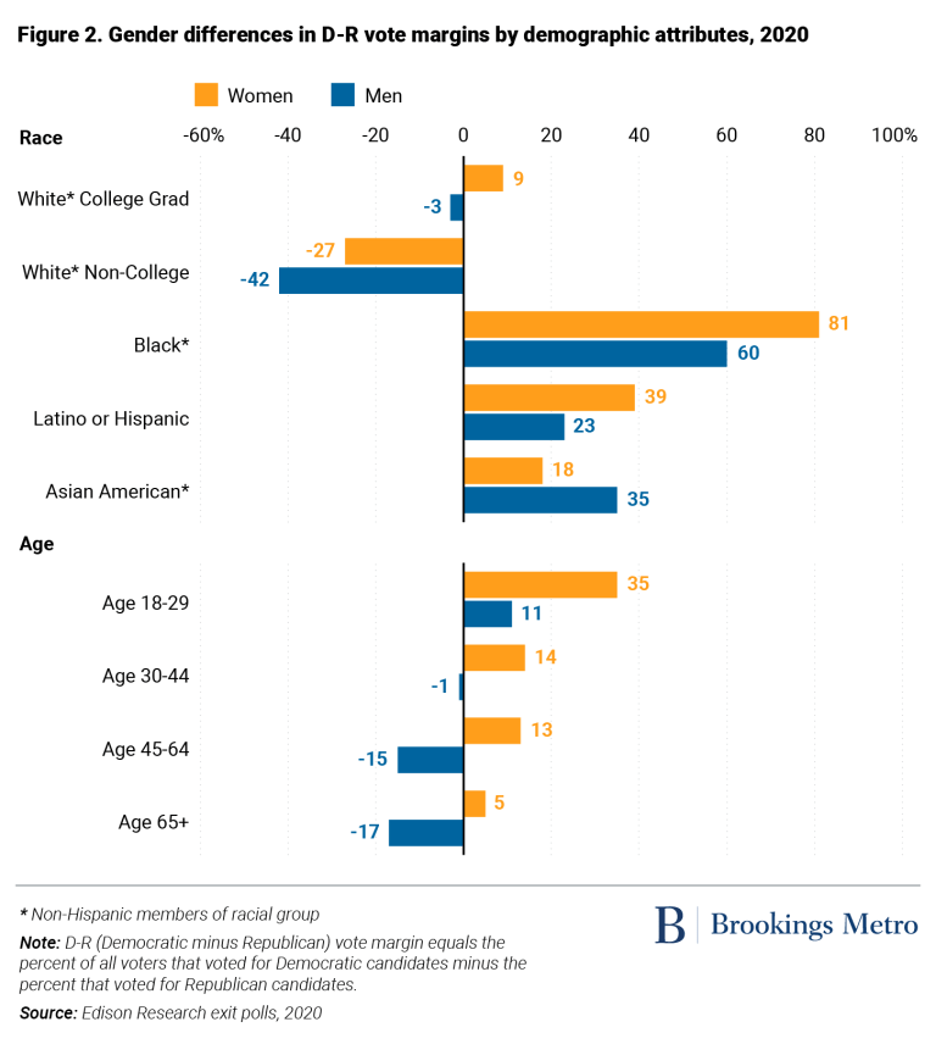
Gender differences also pervade demographic groups. This is evident for the 2020 presidential election as shown in Figure 2, although it was also pervasive in earlier elections. D-R margins are higher for women than for men in groups where women vote strongly Democratic: Black voters, Latino or Hispanic voters, and voters aged 18 to 29. Even for white, non-college graduate women voters—who favored Republicans—the negative D-R margins are not as large as those of men. Only among Asian American voters were men’s D-R margins higher than women’s.

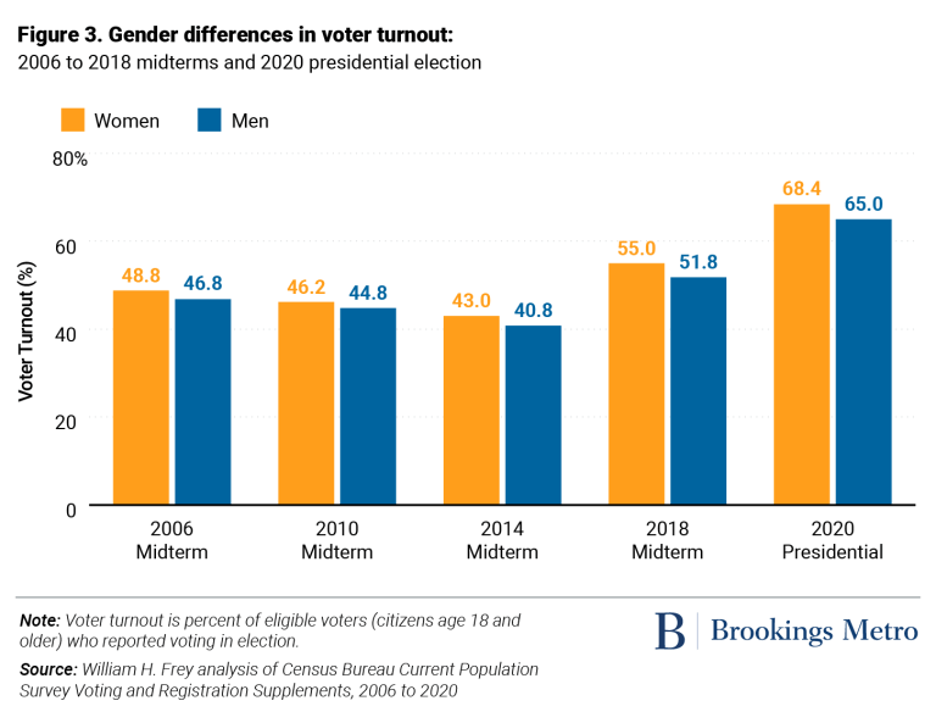
Perhaps even more important in examining women’s power in the coming election is their continued higher turnout rate. There is a long history of higher turnout levels for women than men, dating back to 1980. While the pattern is more pronounced for presidential elections, it is also the case for midterm elections. Figure 3 depicts gender differences in turnout for midterm elections from 2006 to 2018 and the 2020 presidential election. The 2018 midterm showed the highest turnout in decades, as was the case for the 2020 presidential election. In both of these elections, the rise in turnout among women was greater than that of men. Because of this and the fact that women live longer than men, the 2018 election had 8.4 million more female voters than male voters; in the 2020 election, there were 9.7 million more female voters.

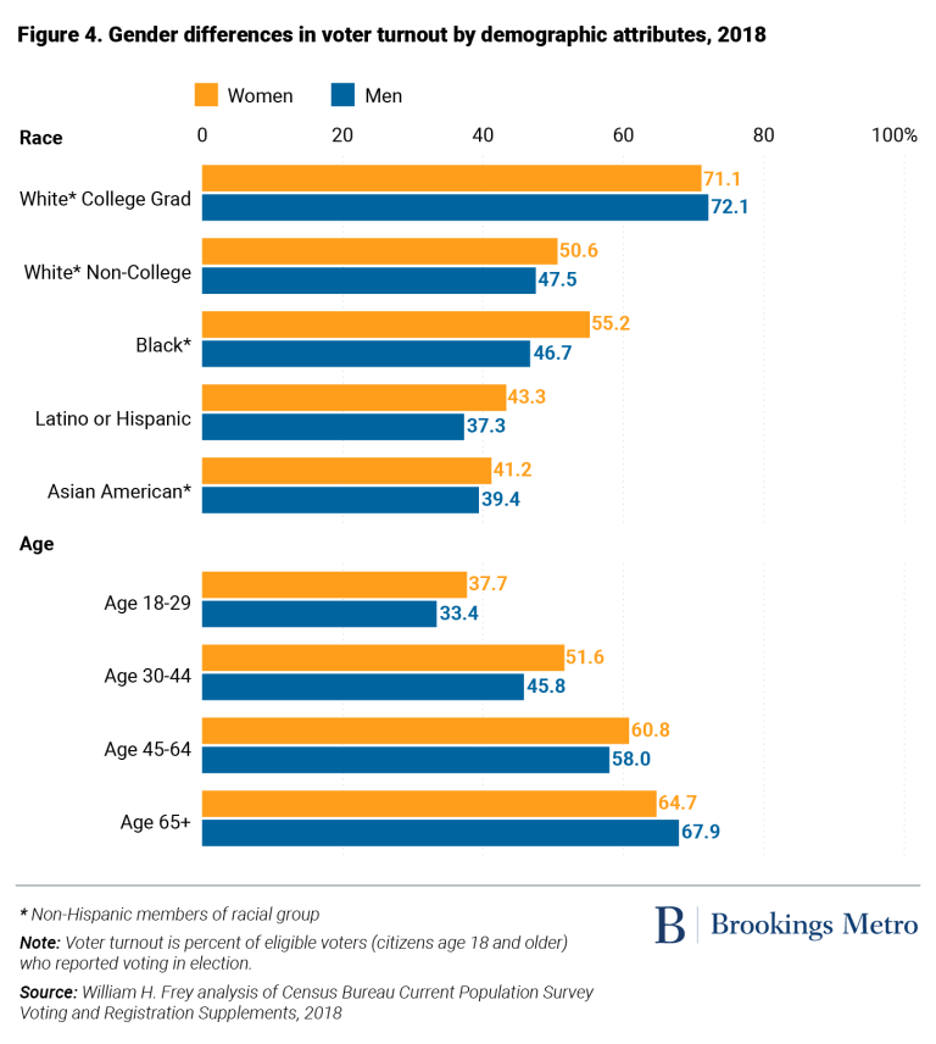
In addition to the overall numeric advantage, women have higher turnout rates across most demographic groups. This is noteworthy among Black women—a strong Democratic voting bloc that in 2018 turned out at 55.2%, compared with 46.7% for Black men. Both white women and white men with college degrees turned out at similar high rates: 71.1% and 72.1%, respectively. Among age groups, women show turnout advantages for all except the 65 and older group, even though women make up 55% of all eligible voters among that group.

Overall, women’s numeric vote advantage in most groups coupled with their broad Democratic leanings make any issues that motivate them to vote Democratic—such as abortion—important to monitor in an election.

THE FEMALE ELECTORATE IS CHANGING

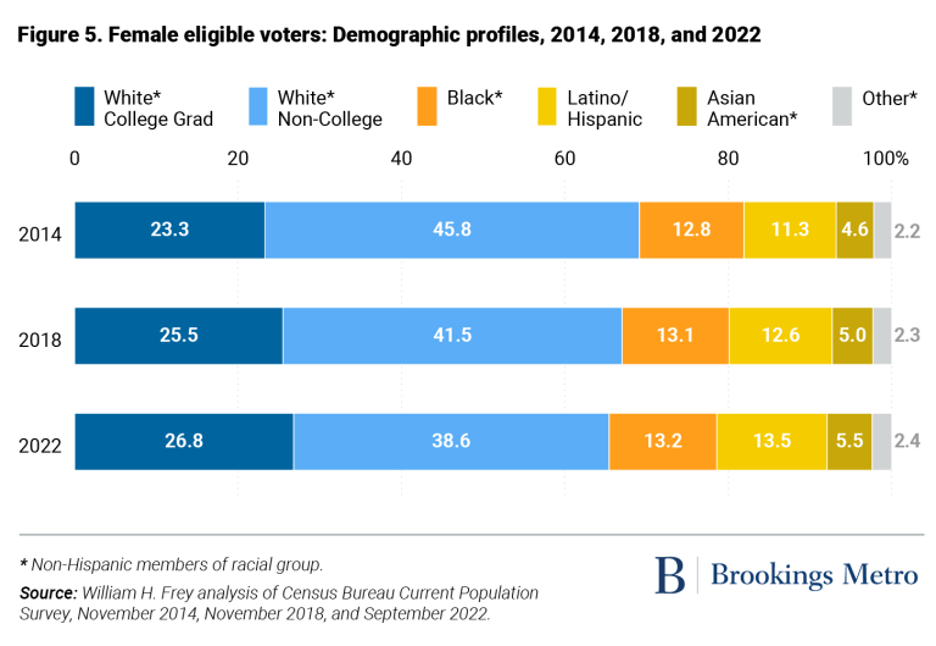
While the size of the female electorate is increasing, its demographic makeup is changing.   Figure 5 shows the shifts in women’s eligible voter profile between 2014 and 2022 by race and education. Notably, there are gains in women’s groups that tend to vote Democratic (white college graduates and people of color), and a decline in the group that tends to vote Republican (white non-college graduates). For the first time in a midterm election, the latter group makes up less than two-fifths of the women’s electorate.

Compared to women, male eligible voters have slightly higher shares of white non-college graduates and smaller shares of white college graduates (downloadable Table A). With respect to age, both female and male eligible voters show older age profiles over time. In 2022, women age 65 and over make up one-quarter of the eligible voter population, while men in that age group make up 22.3%.

SIMULATING THE 2022 GENERIC CONGRESSIONAL BALLOT

As mentioned earlier, recent polls provide some indication of what the midterm election results will be, but they do not take into account the relative size of the voter population, relative turnout rates, and possible last-minute changes in voter preference. This section presents three simulations based on female and male eligible voter populations, turnout rate assumptions, and gender differences in voter preferences based on the polling numbers in the recent Economist/YouGov poll.

In that poll, 51% of women choose a Democratic candidate for a generic 2022 congressional ballot, 46% choose a Republican candidate, and 3% choose other, are not sure, or will/did not vote. Among men, 45% choose a Democratic candidate, 51% choose a Republican candidate, and 4% choose the other categories.

The simulations below show what would happen if, because of concern about abortion, women’s turnout increased by 10 points and women’s Democratic preference increased by 3 points (converting the residual category to Democratic support).

Simulation 1: Assumes 2022 eligible voters by gender, 2018 turnout rates by gender, and 2022 Democratic-Republican congressional preferences by gender

Democratic vote share: 48.2%

Republican vote share:  48.4%

D-R vote margin: -0.2

Simulation 2: Same as Simulation 1, with women’s turnout increased by 10 points

Democratic vote share: 48.4%

Republican vote share: 48.1%

D-R vote margin +0.3

Simulation 3: Same as Simulation 2, with women’s Democratic preference increased by 3 points

Democratic vote share: 50.1%

Republican vote share: 48.1%

D-R vote margin +2.0

The results show that when applied to current female and male eligible voter populations, recent polling would result in a close election outcome with a small Republican advantage. But if the abortion issue motivates greater female turnout and Democratic voting preference, the advantage turns to Democrats.

SIMULATING 2022 ELECTION RESULTS IN BATTLEGROUND STATES

While the national simulations are instructive, great attention will be paid to battleground states with key Senate and gubernatorial elections. This section continues our analysis with simulations for nine of these battleground states: in the North, Ohio, Pennsylvania, and Wisconsin; in the South, Georgia, Florida, North Carolina, and Texas; and in the West, Nevada and Arizona. Each of these has a Senate election except Texas, which has a gubernatorial election.

In place of new polling data, which is not uniformly available for these states, our simulations rely on Democratic and Republican votes by gender from the 2020 presidential election as a baseline (with the exception of Georgia, where votes for the 2020 Senate runoff election were used). These are depicted as women’s and men’s D-R vote margins for each state in Figure 6.

In each state, women overall voted Democratic and men overall voted Republican. Yet the strength of each gender’s support differs, with highest female Democratic support occurring in Wisconsin, Pennsylvania, Nevada, and Georgia and strongest male Republican support in Texas.

In terms of gender differences in turnout rates, each state also showed higher female voter turnout in the 2018 midterm election, with especially strong gender disparities in Ohio and Georgia (downloadable Table B). In the former, women turned out at 55.9% while men turned out at 48.9%; in the latter, the respective rates were 58.3% and 53.1%

It is also worth noting the differences in the race and education profiles of each state’s 2022 eligible voter populations (downloadable Table B). The states with the highest number of Latino or Hispanic eligible voters among both women and men are Texas, Arizona, Nevada, and Florida. Those with the highest number of Black eligible voters are Georgia and North Carolina. Wisconsin, Ohio, and Pennsylvania have the largest number of white eligible voters. It is notable that in Ohio and Wisconsin, over half of all eligible male and female voters are white non-college graduates. In Pennsylvania and Wisconsin, more than 30% of female eligible voters are white college graduates, and in all states, a higher share of men are white non-college graduates than women.

The three state simulations shown in Table 1 follow a similar methodology as used in the national simulations. The base simulation employs 2022 eligible voter populations by gender, to which are applied 2018 turnout rates and Democratic and Republican voter preference—in this case based on the 2020 election. The second simulation assumes that women’s turnout rates are increased by 10 points. The third simulation further assumes that each state’s D-R vote margin for women increases by 5 points.

The base simulation shows an overall Democratic win in five of the nine states. The D-R margins are largest in Nevada, Wisconsin, and Georgia, followed by Arizona and Pennsylvania. Four states—North Carolina, Ohio, Florida, and Texas—show Republican wins, with the largest in Texas, at a -6.6 D-R margin.

The second simulation—which assumes increased women’s turnout—increases the D-R margin in all states but only flips one formerly Republican win to a Democratic one (North Carolina). In contrast, the third simulation, which also assumes increased female support for Democrats, flips all of the states except one (Texas) to a Democratic victory.

In short, these simulations demonstrate that when assuming actual eligible voter populations as a base, increased women’s turnout and Democratic voting can move several battleground states from a Republican to Democratic advantage.

WHAT THE WOMEN’S VOTE MEANS FOR 2022 AND THE FUTURE

The simulations conducted here make plain that women’s enthusiasm for an issue like abortion can lead to consequential shifts in election outcomes through increases in their voter turnout and support for candidates. This can especially benefit Democrats, given the recent history of women’s support for that party’s candidates in national and congressional elections. Unlike looking at polls alone, simulations such as these show how taking into account the actual eligible voter base and turnout rates can affect election results.

These simulations should not be viewed as predictions, as the actual voting behavior will only be known after Election Day. But they do show how, when translated into voter turnout and voting preferences, an energized voting bloc can impact the final election result. They also show that the women’s vote can have a powerful impact on elections not just in 2022 but also in the future. (William H. Frey, Senior Fellow – Brookings Metro)

Picture: NYTimes

Big Cities Saw Population Losses, Suburban Growth Declined During Pandemic

Much has been written about the COVID-19 pandemic’s impact on big-city populations. Brookings Metro’s recent analysis of large metropolitan area declines makes plain that during the prime year of the pandemic (from July 2020 to July 2021) there were outsized population losses in the nation’s biggest metropolitan areas. But more recent Census Bureau estimates focusing on cities (rather than metropolitan areas) show the pandemic’s impact to be even more dramatic, with unprecedented losses across the 88 U.S. cities with populations exceeding 250,000 residents.  

This analysis places these estimates in the context of recent decades’ trends, when America’s big cities experienced noticeable ups and downs. It then shifts the focus to the suburbs of major metropolitan areas, which—while benefitting somewhat from recent city population losses—tend to display growth slowdowns of their own. 

As a group, big cities experienced an absolute population loss during the pandemic 

Big-city growth has shown variations since the turn of the century. In the first part of the 2000-10 decade, big cities took a downturn as easy credit and growth in metro areas with large, sprawling suburbs brought on a suburban boom. This trend was reversed later in the decade due to the 2007-09 Great Recession and near collapse of the housing market, which negatively impacted suburban growth. This led many would-be suburbanites—especially millennials—to instead remain in big cities as they delayed family formation and suburban homeownership, which extended higher city growth rates though the early 2010s. 

As the economy and housing market picked up in the mid-2010s, growth in big cities slowed. The pandemic began to affect city growth in 2019-20, and even more so in 2020-21—the first year this century when large cities in aggregate registered a population loss, declining by 1%. 

Cities that showed the greatest percentage losses were San Francisco, New York, Washington, D.C., and Boston. Substantial losses also occurred in St. Louis and Atlanta (see Figure 2). 

While pandemic decreases in both immigration and natural increase (the excess of births over deaths) brought lower national population, domestic migration played a primary role in city population losses, as shown in Figure 3 for San Francisco and New York. 

The sharp 2020-21 growth slowdown occurred in far more cities than just the above. Among the 88 U.S. cities with populations exceeding 250,000, 77 showed either slower growth, greater declines, or a shift from growth to decline over the previous year. Sixty-two cities registered their lowest growth since at least 2010 (see downloadable Table A). Fourteen cities experienced their first population losses since at least 2010, including Washington, D.C., Atlanta, Denver, Houston, Minneapolis, San Diego, and Seattle. Twenty-eight cites registered slower growth in 2020-21 than the previous year, including the high-growth cities of Fort Worth, Texas; San Antonio; Phoenix; Las Vegas; Jacksonville, Fla.; and Charlotte, N.C. (see Figure 4). 

Among the few cities that grew more rapidly in 2020-21 than in the previous year are four in interior California (Riverside, Stockton, Fresno, and Bakersfield), two in Nevada (Reno and North Las Vegas), as well as Gilbert, Arizona and Raleigh, N.C. Still, over the 2010-21 period, most cities achieved their highest growth rates in the earlier part of the 2010s decade (see downloadable Table A). 

A record number of big cities lost population 

Perhaps the most noteworthy finding for the prime pandemic year is the dramatic rise in the number of cities that lost population. In keeping with the ups and downs of city growth since 2000, there have been sharp changes in the number of big cities that lost population each year. 

The dispersion to smaller areas in the early 2000-10 decade led to increases in the number of big cities that lost population each year, ranging from 29 to 32 of all 88 cities between 2001 and 2005. This diminished to a range of just four to 10 population-losing cities during the post-recession period of 2009 to 2014. The number started to rise again in the mid-2010s, as 23 cities lost population in 2018-19 and 27 in the pandemic’s first year, 2019-20. Yet the sharp increase in number of population-losing cities in 2020-21 (to 51 of the 88 big cities) is of historic proportions for recent decades. 

Population-losing cities are located in all parts of the country, though those with greatest numeric losses (aside from Chicago) tend to be coastal or near coastal cities: New York, San Francisco, Los Angeles, San Jose, Calif., Philadelphia, Washington DC and Boston. Yet many are also in the center of the country, including cities with long-standing population declines (Detroit, Cleveland, Milwaukee, and Buffalo, N.Y.) as well as newer entries such as Indianapolis and Omaha, Neb. Many others are in generally growing parts of the country, including Dallas, Houston, Atlanta, Memphis, Tenn., and Miami in the South, and Denver and Albuquerque, N.M. in the West. 

It is also noteworthy how the list of population-gaining and population-losing cities changes over time (see downloadable Table B). In boom times for cities (such as 2000-01 and right after the Great Recession), New York ranked first in overall population gains, whereas during the down years, it ranked among the those with greatest population losses—fifth in 2005-06 and first in each year from 2016-17 to 2020-21. Los Angeles, Houston, and Dallas also flipped from being among the greatest population-gaining cities in 2010-11 to those with population losses in 2020-21. Note as well that Phoenix, San Antonio, and Fort Worth were among the 10 highest-gaining cities for most years since 2005-06, though each showed far lower growth in 2020-21 than in earlier years 

Suburbs of large metro areas registered growth declines in 2020-21 

The sharp decline in city growth during the pandemic’s prime year did not generally lead to equivalent rises in suburban growth in the nation’s 56 major metropolitan areas (those with populations exceeding 1 million). This is because these areas also showed substantial metropolitan-wide growth slowdowns, affecting the suburbs as well as cities. 

Nonetheless, most suburban portions of metropolitan areas (the areas that lie outside of primary cities) continued to grow more rapidly than those cities. Figure 6 shows the annual growth of the aggregated primary city and suburban populations for the nation’s major metro areas between 2010 and 2021.[2]  For the first half of the 2010s, overall primary city growth exceeded suburban growth. This shifted in 2015-16, as primary city growth rates declined, continuing though 2020-21, when that growth became negative. 

Among the nation’s 56 major metro areas, primary city populations grew faster than their suburbs in 29 during the first two years of the 2010s decade. This fell to just six in 2020-21 (see downloadable Table C). 

While suburban growth remained higher than primary city growth though this latter period, it too began to decline, especially over the past two years. The combined suburban populations grew by nearly 1% annually during the first five years of the 2010s, but that rate shrunk to just 0.26% in 2020-21. 

Although many suburban areas received some in-migration from their primary cities, they also saw smaller contributions from immigration and natural increase. Between 2019-20 and 2020-21, 43 of the 56 major metro area suburbs showed either declining growth or increased population losses, and 31 experienced their slowest annual growth since at least 2010. Nineteen of the 56 suburbs sustained population losses in 2020-21, compared with just six or fewer in the early years of the decade. 

Among major metro areas experiencing suburban population declines in the last year are Boston, Cleveland, Los Angeles, and Seattle. Each displayed somewhat different patterns since 2010. All four areas showed negative primary city growth in the last year (Seattle for the first time). In the Boston metro area, primary cities grew more rapidly than suburbs until 2019-20, though its suburban population declined then as well. In the Cleveland metro area, both the primary city and its suburbs displayed negative growth throughout the period, with the city seeing a bigger 2020-21 decline. In the Los Angeles metro area, the primary city grew more rapidly (or declined less) than its suburbs throughout the decade, though both took a huge dip in 2020-21. And in the Seattle metro area, the primary city outgrew its suburbs each year until 2020-21, when both displayed sharp population declines—the city’s being slightly larger than the suburbs’. 

The future of big cities in the post-pandemic period 

The historic population declines in the nation’s largest cities raise the question of how unusual this prime pandemic period was. Examining data going back two decades, there was no individual year that comes close to showing the population declines that these cities witnessed in 2020-21, alongside slower growth in their entire metro areas and suburbs. 

Recent analyses of statistics from the U.S. Postal Service and other sources suggest that this 12-month period might be an aberration, and that some of the reasons for a dispersion away from these cities (such as an escape from density for pandemic-related safety reasons) may no longer be salient. Still, the patterns of telecommuting that have begun to take hold may make a “return to the city” less inevitable than it would otherwise be. 

While many of those who fled cities may not return, future city gains may well be in the hands of younger generations and new immigrant waves—groups that in the past tended to choose big cities as their destinations.

U.S. Population Growth Has Nearly Flatlined, New Census Data Shows

America’s population size is standing still, according to new data from the U.S. Census Bureau. Population growth over the 12-month period from July 1, 2020 through July 1, 2021 stood at unprecedented low of just 0.12%. This is the lowest annual growth since the Bureau began collecting such statistics in 1900, and reflects how all components of population change—deaths, births, and immigration levels—were impacted during a period when the COVID-19 pandemic became most prevalent.

The new estimates show that during this period, population growth declined from the previous year in 31 of 50 states as well as Washington, D.C., with 18 states sustaining absolute population losses. In some states, especially California and New York, population losses were exacerbated by inflated out-migration during the pandemic, just as other states such as Florida and Texas benefitted from greater population in-flows.

While COVID-19 clearly played a role in this near-zero population growth, that growth had begun to plummet even before the pandemic. The 2020 census showed that from 2010 to 2020, the U.S. registered the second-lowest decade growth in its history—a consequence, in large part, of the aging of its population, which led to more deaths and fewer births. Nonetheless, the new data shows that pandemic-related demographic forces have left an indelible mark on the nation.

Historic dips and spikes in population growth follow pandemics and economic trends

The unprecedented near cessation of U.S. population growth is depicted in Figure 1, which charts annual growth rates in the 121-year period from 1900 to 2021. Over this time, the nation experienced wide variations in growth, resulting from wars, economic booms and busts, as well as changing fertility and immigration patterns.

Noteworthy are the sharp dips in growth: in 1918-19, due largely to the Spanish Flu pandemic, and in the late 1920s and early 1930s as a result of the Great Depression. Growth rose to levels approaching 2% during the prosperous post-World War II “baby boom” years of the 1950s and 1960s. And after a lull in the 1970s and 1980s, population growth rose again in the 1990s due to rising immigration and millennial generation births.

The 21st century ushered in another population growth downturn, exacerbated by the 2007-09 Great Recession. This spilled into a 2010s decade-wide growth slowdown that provided a backdrop for the nearly flat growth of 0.12% in 2020-21. This most recent statistic reflects more deaths and fewer births associated with an aging population along with greater restrictions in immigration near the end of the decade, even before the pandemic hit.

The factors that led to today’s unprecedented flat growth rate

The demographic components of reduced population growth in 2020-21 are depicted in Figure 2, which contrasts year-by-year changes since 2000 in what demographers call “natural increase”—the excess of births over deaths as well as net international migration.

As indicted above, declines in the nation’s natural increase levels during the 2010s reflected more deaths associated with an aging population as well as the after-effects of the Great Recession in the postponement of childbearing for young adult women. Immigration trends were more uneven due to changing economic circumstances, including the recession and immediate post-recession downturn, as well as immigration policies that became more restrictive during the Trump administration.

Both natural increase and immigration contributions to population growth became markedly reduced in 2020-21, in large part due to the pandemic. (Pandemic impacts were partially evident already in 2019-20 data.) Population gains attributable to natural increase rose as high as 1.1 million in 2016-17, but dropped to 677,000 in 2019-20 and then again to 148,000 in 2020-21. Over the past two years, the number of deaths in the U.S. rose by 363,000 (from 3.07 million to 3.43 million) and the number of births declined by 166,000 (from 3.74 million to 3.58 million)—reflecting, in part, pandemic-related decisions to postpone having children.

Immigration levels plummeted as well, exacerbating the impacts of earlier policy restrictions. The new estimates showed a net international migration of just 256,000 in 2020-21—down from an already low 477,000 in 2019-20 and from over 1 million per year in the middle of the 2010s decade.

Despite this decline in immigration, it was the dip in natural increase—propelled by deaths during the pandemic—that drove much of the nation’s dramatic growth slowdown.  In contrast to earlier years, the contribution of natural increase to the nation’s growth was even less than that of immigration.

Eighteen states lost population in the past year

The national growth slowdown exerted a broad impact across the nation’s states. Among the nation’s 50 states and Washington, D.C., 31 showed lower growth (or greater losses) in 2020-21 than in 2019-20 (see downloadable Table B).

The states that led in growth rates were mostly in the Mountain West, including Idaho, Utah, Montana, and Arizona, which had annual rates exceeding 1.4%. In terms of numeric growth, the biggest gainers in 2020-21 were Texas (310,000 people), Florida (211,000), Arizona (98,000), and North Carolina (93,000). Still, these gains were smaller than what these states saw in 2019-20 or 2018-19.

Table 1. States with population declines, 2018-19, 2019-20, 2020-21

2018-2019 2019-2020 2020-2021
New York -80,967 New York -126,355 New York -319,020
Illinois -57,668 Illinois -79,487 California -261,902
West Virginia -10,690 California -69,532 Illinois -113,776
Pennsylvania -10,224 Michigan -18,240 Massachusetts -37,497
Connecticut -8,539 Pennsylvania -15,629 Louisiana -27,156
Hawaii -7,487 Louisiana -12,967 Pennsylvania -25,569
Louisiana -6,165 Mississippi -11,441 District of Columbia -20,043
Mississippi -4,652 West Virginia -10,476 Michigan -16,853
Alaska -3,021 Connecticut -9,016 New Jersey -12,613
Michigan -2,491 New Jersey -8,887 Ohio -10,570
Rhode Island -1,180 Hawaii -8,609 Hawaii -10,358
Vermont -756 Ohio -3,290 Maryland -7,550
New Jersey -472 Alaska -2,445 Mississippi -6,905
Kansas -113 Massachusetts -1,309 West Virginia -6,839
Rhode Island -1,033 North Dakota -4,014
Vermont -699 New Mexico -1,689
Kansas -1,298
Rhode Island -619

Source: William H. Frey analysis of US Census Bureau estimates, released December 21, 2021

Perhaps most noteworthy is the fact that 18 states (including Washington, D.C.) lost population in 2020-21. This is up from 16 population-losing states 2019-20; 14 in 2018-19; and just 10 in the two prior years.

New York and California registered the biggest numeric losses. Both states showed substantially greater losses in 2020-21 than in the prior two years, as was the case for most states that sustained recent population losses.

Twenty-five states registered more deaths than births

The poor growth performance of most states in 2020-21 reflects a combination of lower natural increase and smaller immigration from abroad—components which led to reduced national growth and reduced domestic migration across states (see downloadable Table C).

All 50 states and Washington, D.C. displayed lower natural increase in 2020-21 than in the previous year. Moreover, 25 states showed what demographers call “natural decrease”—an excess of deaths over births. Led by Florida, Pennsylvania, Ohio, Michigan, and West Virginia, most of these states are in the nation’s Northeast, Midwest, and Southeast. Just eight of these states registered natural decreases in 2019-20; in 2018-19, this was the case for only four (West Virginia, Maine, New Hampshire, and Vermont).

Similarly, immigration from abroad was lower across all 50 states and Washington, D.C. in 2020-21 than in the previous year. This is especially the case for those with greatest immigrant gains: Florida, Texas, New York, and California.

Domestic migration sharpened state gains and losses

Domestic migration (movement within the U.S.) is the one demographic component which can either worsen or improve state population growth in a slow growth environment. This was especially the case during the past year, when pandemic-related economic, social, and safety factors prompted selective movement flows.

The new census estimates show how domestic migration impacted states which both lost and gained population. For example, the three states with the greatest overall population losses—New York, California, and Illinois—were the three leaders in net out-migration.    These states contain major cities and metropolitan areas, which have been associated with out-migration during the pandemic, and registered greater out-migration in 2020-21 than in each of the previous two years. It is also noteworthy that Washington, D.C. lost 23,000 domestic migrants—a huge outlier from earlier years, when the city experienced far smaller migration losses or gains (see downloadable Table C).

Similarly, states with the greatest overall population gains—Texas, Florida, and Arizona—were leaders in 2020-21 domestic in-migration. Just as most migrant-losing states shed greater numbers of migrants during the pandemic than earlier, it is the case that most migrant-gaining states (Arizona and Nevada were among the exceptions) gained more migrants than before.

A historic demographic low point

Among the many consequences the COVID-19 pandemic has inflicted on the nation, its impact on the nation’s demographic stagnation is likely to be consequential. The new census estimates make plain that as a result of more deaths, fewer births, and a recent low in immigration, America has achieved something close to zero growth in the 2020-21 period. This trend has affected most states, and will lead to sharp changes in how many Americans make decisions about childbearing as well as where and how they live.

While it is true that the rise in pandemic-period deaths—especially among the older population—contributed much to this slow growth, declines in fertility and immigration also added a great deal. Because the latter demographic components contribute most to any future rise in the nation’s youth and labor-force-age population, it is vital that we examine public policies that can overcome barriers to the bearing and raising of children and, probably most important, stimulate immigration in ways that will reinvigorate the nation’s population growth.

Even before the onset of the pandemic, Census Bureau projections foresaw the onset of slower growth, increased aging, and continued stagnation of our labor force. Among the many ways that are needed to recover from the pandemic, a focus on reactivating the nation’s population growth should be given high priority.

-+=