Gun Deaths Among Children & Teens Rose 50% In 2 Years

The number of children and teens killed by gunfire in the United States increased 50% between 2019 and 2021, according to a Pew Research Center analysis of the latest annual mortality statistics from the Centers for Disease Control and Prevention (CDC).

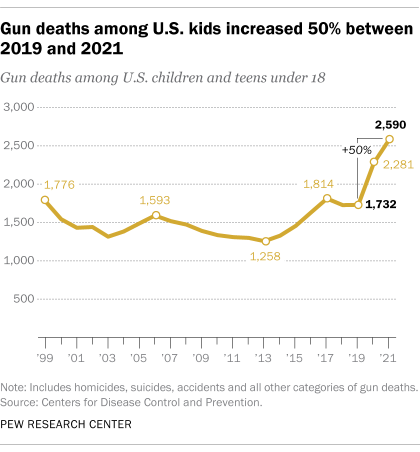
In 2019, before the coronavirus pandemic, there were 1,732 gun deaths among U.S. children and teens under the age of 18. By 2021, that figure had increased to 2,590.

The gun death rate among children and teens – a measure that adjusts for changes in the nation’s population – rose from 2.4 fatalities per 100,000 minor residents in 2019 to 3.5 per 100,000 two years later, a 46% increase.

Both the number and rate of children and teens killed by gunfire in 2021 were higher than at any point since at least 1999, the earliest year for which information about those younger than 18 is available in the CDC’s mortality database.

How we did this

The rise in gun deaths among children and teens is part of a broader recent increase in firearm deaths among Americans overall. In 2021, there were 48,830 gun deaths among Americans of all ages – by far the highest yearly total on record and up 23% from the 39,707 recorded in 2019, before the pandemic.

The total number of gun deaths among children and teens in 2021 includes homicides, suicides, accidents and all other categories where firearms are listed on death certificates as the underlying cause of death. It does not include deaths where firearms are listed as a contributing, but not underlying, cause of death.

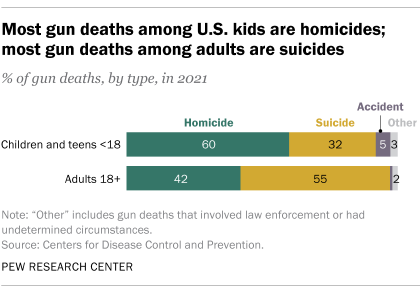
Homicide was the largest single category of gun deaths among children and teens in 2021, accounting for 60% of the total that year. It was followed by suicide at 32% and accidents at 5%. Among U.S. adults, by contrast, suicides accounted for a 55% majority of gun deaths in 2021.

In addition to data on gun fatalities, the CDC publishes estimates on nonfatal gun-related injuries sustained by children and teens. In 2020 – the most recent year with available data – there were more than 11,000 emergency-room visits for gunshot injuries among children and teens under the age of 18 – far higher than in other recent years. An exact count is not possible, however, because the CDC’s estimate is based on a sample of U.S. hospitals, not all U.S. hospitals, and is subject to a large margin of error.

Gun deaths are much more common among some groups of children and teens

In the U.S., some groups of children and teens are far more likely than others to die by gunfire. Boys, for example, accounted for 83% of all gun deaths among children and teens in 2021. Girls accounted for 17%.

Older children and teens are much more likely than younger kids to be killed in gun-related incidents. Those ages 12 to 17 accounted for 86% of all gun deaths among children and teens in 2021, while those 6 to 11 accounted for 7% of the total, as did those 5 and under. Still, there were 179 gun deaths among children ages 6 to 11 and 184 among those 5 and under in 2021.

For all three age groups, homicide was the leading type of gun death in 2021. But suicides accounted for a significant share (36%) of gun deaths among those ages 12 to 17, while accidents accounted for a sizable share (34%) of gun deaths among those 5 and under.

Racial and ethnic differences in gun deaths among kids are stark. In 2021, 46% of all gun deaths among children and teens involved Black victims, even though only 14% of the U.S. under-18 population that year was Black. Much smaller shares of gun deaths among children and teens in 2021 involved White (32%), Hispanic (17%) and Asian (1%) victims.

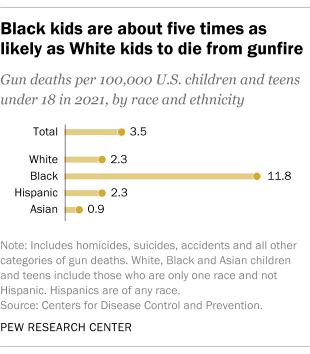
Looked at another way, Black children and teens were roughly five times as likely as their White counterparts to die from gunfire in 2021. There were 11.8 gun deaths per 100,000 Black children and teens that year, compared with 2.3 gun deaths per 100,000 White children and teens. The gun death rate among Hispanic children and teens was also 2.3 deaths per 100,000 in 2021, while it was lower among Asian children and teens (0.9 per 100,000).

There are also major racial and ethnic differences in the types of gun deaths involving children and teens. In 2021, a large majority of gun deaths involving Black children and teens (84%) were homicides, while 9% were suicides. Among White children and teens, by contrast, the majority of gun deaths (66%) were suicides, while a much smaller share (24%) were homicides.

In this analysis, Black, White and Asian children and teens include only those who are single-race and not Hispanic, while Hispanic children and teens are of any race.

Nearly half of U.S. parents worry about their children getting shot

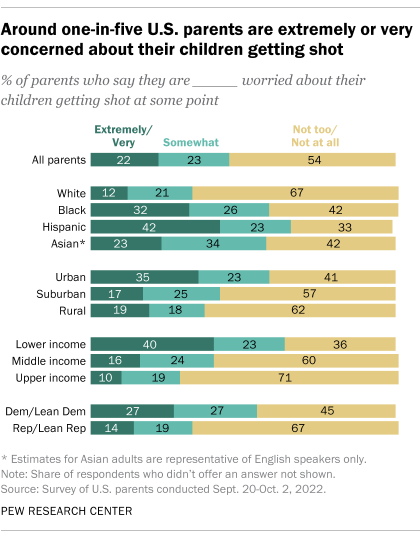
A sizable share of American parents are worried about their kids getting shot. In a fall 2022 Pew Research Center survey, 22% of parents with children under 18 said they were extremely or very worried about any of their children getting shot at some point, while another 23% said they were somewhat worried. Still, more than half said they were not worried about this.

The survey found demographic differences in these concerns. Around four-in-ten Hispanic parents (42%) and about a third of Black parents (32%) said they were extremely or very worried about their children getting shot, compared with smaller shares of Asian (23%) and White (12%) parents.

Parents in self-described urban communities (35%) were considerably more likely than those in rural (19%) or suburban (17%) areas to be extremely or very worried about any of their children being shot. And lower-income parents (40%) were far more likely than middle-income (16%) and upper-income (10%) parents to be extremely or very worried.

Partisan differences were evident, too. Democratic and Democratic-leaning parents were roughly twice as likely as Republican and Republican-leaning parents to say they were extremely or very worried about their children getting shot at some point (27% vs. 14%). )PEW Research)

Biden Has Appointed More Federal Judges Than Any President Since JFK At This Point In His Tenure

President Joe Biden has appointed more judges to the federal courts at this stage in his tenure than any president since John F. Kennedy, and his appointees include a record number of women and racial and ethnic minorities, according to a Pew Research Center analysis of data from the Federal Judicial Center.

As of Aug. 8, the first day of the U.S. Senate’s August break, Biden has successfully appointed 75 judges to the three main tiers of the federal judicial system: the district courts, appeals courts and U.S. Supreme Court. That’s far more than the number appointed by Donald Trump (51) and Barack Obama (42) at the same stage in their presidencies, and slightly more than the number appointed by several other recent presidents – including George W. Bush (72), Bill Clinton (74) and Ronald Reagan (72) – by this point in their tenures.

Among all presidents going back to Dwight D. Eisenhower, only Kennedy had appointed more federal judges than Biden at the same stage of his tenure. Kennedy had appointed 102 judges by then, far outpacing the total of every other modern president in the same amount of time. (This analysis begins with Eisenhower because he was the first president to be inaugurated to a first term on Jan. 20.)

How we did this

Most of Biden’s appointed judges to date (57 out of 75, or 76%) have been district court judges, who preside over criminal and civil trials. A much smaller share (18 out of 75, or 24%) have been appeals court judges – the powerful jurists who are a level above district court judges, hear federal legal appeals and often have the last word on interpretations of federal law. Biden has also appointed one justice to the nation’s highest court: Ketanji Brown Jackson, who formally joined the Supreme Court in June. Biden had previously appointed Jackson to an appeals court position.

Trump, by comparison, had appointed a much smaller share of district court judges at this point in his presidency than Biden (26 of 51, or 51%), but a much larger share of appeals court judges (24 of 51, or 47%). Like Biden, Trump had also successfully appointed one Supreme Court justice by this point in his tenure: Neil Gorsuch. Over the full course of his presidency, Trump reshaped the federal judiciary – particularly the higher courts – by filling a large number of vacancies on the appeals courts and the Supreme Court.

Federal judicial appointments are consequential not only because of the important rulings that judges issue, but because federal judges have lifetime tenure and typically serve for many years after the presidents who appointed them have left office. The average Supreme Court justice, for example, has served on the court for nearly 17 years, according to a 2017 Center analysis of all former justices at the time.

Biden’s fast pace of judicial appointments to date partly reflects the fact that Democrats control the U.S. Senate, which considers and confirms presidential appointees. It also reflects the fact that judicial nominees can now be confirmed with a simple majority vote in the Senate – unlike in the past, when such nominees needed 60 votes to overcome the threat of a filibuster. The current Senate is evenly divided between Democrats and Republicans, but Democrats control the chamber due to the tiebreaking vote of Vice President Kamala Harris.

There are currently 72 vacancies for judgeships in the nation’s district and appeals courts (including some territorial courts), according to the Administrative Office of the U.S. Courts, suggesting that Biden still could fill dozens of seats in the months ahead. But the pace of his judicial appointments will depend on several factors, including whether Republicans take control of the Senate next year.

Most of Biden’s appointed judges have been women, racial and ethnic minorities

In addition to the large overall number of judges Biden has appointed so far, the 46th president stands out for the many women and racial and ethnic minorities he has appointed to the bench.

As of Aug. 8, around three-quarters of Biden’s confirmed federal judges (57 of 75, or 76%) have been women. Biden has appointed by far the highest number and share of women judges of any president at this point in his tenure.

Biden has also appointed the highest number and share of non-White federal judges of any president at this stage in his administration (49 of 75, or 65%). His confirmed judges so far include a record number who are Hispanic (13) and Asian (10), but he has appointed slightly fewer Black federal judges than Bill Clinton had at the same point in his tenure (18 vs. 20).

Most of the Black judges Biden has appointed to date (14 of 18) are women. That includes Jackson, who is the first-ever Black woman to serve on the Supreme Court. So far, only four of Biden’s 75 judicial appointees (5%) have been White men, by far the lowest share among all presidents analyzed.

In addition to demographic diversity, Biden has emphasized professional diversity in his judicial appointments to date. An analysis by the Brookings Institution in January found that Biden had appointed a record number of former public defenders to federal judgeships in his first year in office.

Biden has appointed around one-in-ten currently active federal judges

Another way of looking at the effect that each president has had on the federal judiciary is to evaluate the share of currently active judges who were appointed by each chief executive.

As of Aug. 8, there are 790 active federal judges serving in the 91 district courts and 13 appeals courts governed by Article III of the U.S. Constitution, as well as the Supreme Court. Biden appointed 9% of those judges, a relatively small figure that reflects the fact that he has only been in office for about a year and a half.

Other recent presidents have appointed larger shares of currently active judges. Trump appointed 28% of active federal judges, while Obama appointed 35% and George W. Bush appointed 17%. Not surprisingly, relatively few judges who are still active today were appointed by presidents who served more than two decades ago – including Clinton, George H.W. Bush and Reagan.

The current federal judiciary is closely divided between appointees of Democratic presidents, who comprise 52% of all active judges, and of Republican presidents, who account for 48%. But that breakdown varies by type of court. More than half of currently active district court judges were appointed by Democratic presidents (53%), while a smaller share (47%) were appointed by GOP presidents. The reverse is true in the appeals courts, where 53% of active judges were appointed by Republican presidents and 47% were appointed by Democrats. The Supreme Court consists of six justices appointed by Republican presidents and three justices appointed by Democrats, a 67%-33% split in favor of GOP appointees.

Counting Gun Deaths In The U.S.

More Americans died of gun-related injuries in 2020 than in any other year on record, according to recently published statistics from the Centers for Disease Control and Prevention (CDC). That included a record number of gun murders, as well as a near-record number of gun suicides. Despite the increase in such fatalities, the rate of gun deaths – a statistic that accounts for the nation’s growing population – remains below the levels of earlier years.

Here’s a closer look at gun deaths in the United States, based on a Pew Research Center analysis of data from the CDC, the FBI and other sources. You can also read key public opinion findings about U.S. gun violence and gun policy in our recent roundup.

How we did this

How many people die from gun-related injuries in the U.S. each year?

In 2020, the most recent year for which complete data is available, 45,222 people died from gun-related injuries in the U.S., according to the CDC. That figure includes gun murders and gun suicides, along with three other, less common types of gun-related deaths tracked by the CDC: those that were unintentional, those that involved law enforcement and those whose circumstances could not be determined. The total excludes deaths in which gunshot injuries played a contributing, but not principal, role. (CDC fatality statistics are based on information contained in official death certificates, which identify a single cause of death.)

What share of U.S. gun deaths are murders and what share are suicides?

Though they tend to get less public attention than gun-related murders, suicides have long accounted for the majority of U.S. gun deaths. In 2020, 54% of all gun-related deaths in the U.S. were suicides (24,292), while 43% were murders (19,384), according to the CDC. The remaining gun deaths that year were unintentional (535), involved law enforcement (611) or had undetermined circumstances (400).

What share of all murders and suicides in the U.S. involve a gun?

Nearly eight-in-ten (79%) U.S. murders in 2020 – 19,384 out of 24,576 – involved a firearm. That marked the highest percentage since at least 1968, the earliest year for which the CDC has online records. A little over half (53%) of all suicides in 2020 – 24,292 out of 45,979 – involved a gun, a percentage that has generally remained stable in recent years.

How has the number of U.S. gun deaths changed over time?

The 45,222 total gun deaths in 2020 were by far the most on record, representing a 14% increase from the year before, a 25% increase from five years earlier and a 43% increase from a decade prior.

Gun murders, in particular, have climbed sharply in recent years. The 19,384 gun murders that took place in 2020 were the most since at least 1968, exceeding the previous peak of 18,253 recorded by the CDC in 1993. The 2020 total represented a 34% increase from the year before, a 49% increase over five years and a 75% increase over 10 years.

The number of gun suicides has also risen in recent years – climbing 10% over five years and 25% over 10 years – and is near its highest point on record. The 24,292 gun suicides that took place in 2020 were the most in any year except 2018, when there were 24,432.

How has the rate of U.S. gun deaths changed over time?

While 2020 saw the highest total number of gun deaths in the U.S., this statistic does not take into account the nation’s growing population. On a per capita basis, there were 13.6 gun deaths per 100,000 people in 2020 – the highest rate since the mid-1990s, but still well below the peak of 16.3 gun deaths per 100,000 people in 1974.

The gun murder and gun suicide rates in the U.S. both remain below their peak levels. There were 6.2 gun murders per 100,000 people in 2020, below the rate of 7.2 recorded in 1974. And there were 7.0 gun suicides per 100,000 people in 2020, below the rate of 7.7 measured in 1977. (One caveat when considering the 1970s figures: In the CDC’s database, gun murders and gun suicides between 1968 and 1978 are classified as those caused by firearms and explosives. In subsequent years, they are classified as deaths involving firearms only.)

Which states have the highest and lowest gun death rates in the U.S.?

The rate of gun fatalities varies widely from state to state. In 2020, the states with the highest rates of gun-related deaths – counting murders, suicides and all other categories tracked by the CDC – included Mississippi (28.6 per 100,000 people), Louisiana (26.3), Wyoming (25.9), Missouri (23.9) and Alabama (23.6). The states with the lowest rates included New York (5.3), Rhode Island (5.1), New Jersey (5.0), Massachusetts (3.7) and Hawaii (3.4).

How does the gun death rate in the U.S. compare with other countries?

The gun death rate in the U.S. is much higher than in most other nations, particularly developed nations. But it is still far below the rates in several Latin American countries, according to a 2018 study of 195 countries and territories by researchers at the Institute for Health Metrics and Evaluation at the University of Washington.

The U.S. gun death rate was 10.6 per 100,000 people in 2016, the most recent year in the study, which used a somewhat different methodology from the CDC. That was far higher than in countries such as Canada (2.1 per 100,000) and Australia (1.0), as well as European nations such as France (2.7), Germany (0.9) and Spain (0.6). But the rate in the U.S. was much lower than in El Salvador (39.2 per 100,000 people), Venezuela (38.7), Guatemala (32.3), Colombia (25.9) and Honduras (22.5), the study found. Overall, the U.S. ranked 20th in its gun fatality rate that year.

How many people are killed in mass shootings in the U.S. every year?

This is a difficult question to answer because there is no single, agreed-upon definition of the term “mass shooting.” Definitions can vary depending on factors including the number of victims and the circumstances of the shooting.

The FBI collects data on “active shooter incidents,” which it defines as “one or more individuals actively engaged in killing or attempting to kill people in a populated area.” Using the FBI’s definition, 38 people – excluding the shooters – died in such incidents in 2020.

The Gun Violence Archive, an online database of gun violence incidents in the U.S., defines mass shootings as incidents in which four or more people are shot, even if no one was killed (again excluding the shooters). Using this definition, 513 people died in these incidents in 2020.

Regardless of the definition being used, fatalities in mass shooting incidents in the U.S. account for a small fraction of all gun murders that occur nationwide each year.

How has the number of mass shootings in the U.S. changed over time?

Striving to arrive at an exact number of mass shooting fatalities comes into play when trying to determine the frequency of U.S. mass shootings over time. The unpredictability of these incidents also complicates matters: As Rand Corp. noted in a research brief, “Chance variability in the annual number of mass shooting incidents makes it challenging to discern a clear trend, and trend estimates will be sensitive to outliers and to the time frame chosen for analysis.”

The FBI found an increase in active shooter incidents between 2000 and 2020. There were three such incidents in 2000; by 2020, that figure had increased to 40.

Which types of firearms are most commonly used in gun murders in the U.S.?

In 2020, handguns were involved in 59% of the 13,620 U.S. gun murders and non-negligent manslaughters for which data is available, according to the FBI. Rifles – the category that includes guns sometimes referred to as “assault weapons” – were involved in 3% of firearm murders. Shotguns were involved in 1%. The remainder of gun homicides and non-negligent manslaughters (36%) involved other kinds of firearms or those classified as “type not stated.”

It’s important to note that the FBI’s statistics do not capture the details on all gun murders in the U.S. each year. The FBI’s data is based on information voluntarily submitted by police departments around the country, and not all agencies participate or provide complete information each year.

-+=