
Americans who have been to the grocery store lately or started their holiday shopping may have noticed that consumer prices have spiked. The annual rate of inflation in the United States hit 6.2% in October 2021, the highest in more than three decades, as measured by the Consumer Price Index (CPI). Other inflation metrics also have shown significant increases in recent months, though not to the same extent as the CPI.
Understanding why the rate of inflation has risen so quickly could help clarify how long the surge might last – and what, if anything, policymakers should do about it. The recent acceleration in the rate of inflation appears to be fundamentally different from other inflationary periods that were more closely tied to the regular business cycle. Explanations for the current phenomenon proffered to date include continuing disruptions in global supply chains amid the coronavirus pandemic; turmoil in the labor markets; the fact that today’s prices are being measured against prices during last year’s COVID-19-induced shutdowns; and strong consumer demand after local economies were reopened.
How we did this
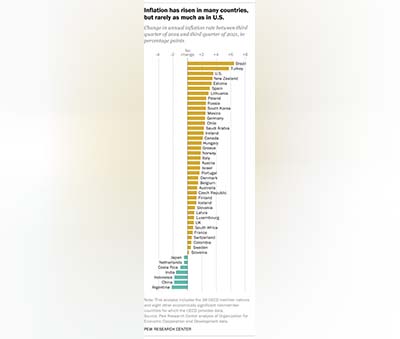 At least one thing is clear: A resurgent inflation rate is by no means solely a U.S. concern. A Pew Research Center analysis of data from 46 nations finds that the third-quarter 2021 inflation rate was higher in most of them (39) than in the pre-pandemic third quarter of 2019. In 16 of these countries, including the U.S., the inflation rate was more than 2 percentage points higher last quarter than in the same period of 2019. (For this analysis, we used data from the Organization for Economic Cooperation and Development, a group of mostly highly developed, democratic countries. The data covers the 38 OECD member nations, plus eight other economically significant countries.)
At 5.3%, the U.S. had the eighth-highest annual inflation rate in the third quarter of 2021 among the 46 countries examined, narrowly edging out Poland. The increase in the U.S. inflation rate – 3.58 percentage points between the third quarter of 2019 and the third quarter of 2021 – was the third highest in the study group, behind only Brazil and Turkey, both of which have substantially higher inflation rates in general than the U.S. does.
Regardless of the absolute level of inflation in each country, many show variations on the same pattern: relatively low inflation before the COVID-19 pandemic struck in the first quarter of 2020; flat or falling inflation for the rest of that year and into 2021, as many governments sharply curtailed most economic activity; and rising inflation in the second and third quarters of this year, as the world struggled to get back to something approaching normal.
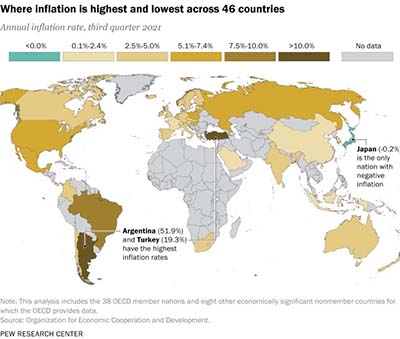 For most countries in this analysis, 2021 has marked a sharp break from what had been an unusually long period of low-to-moderate inflation. In fact, during the decade leading up to the pandemic, 34 of the 46 countries in the analysis averaged changes in inflation rates of 2.6% or lower. In 27 of these countries, inflation rates averaged less than 2%. The biggest exception was Argentina, whose economy has been plagued by high inflation and other ills for decades. The OECD has no data on Argentine inflation rates before 2018, but in the 2018-19 period it averaged 44.4%.
At the other end of the spectrum is Japan, which has struggled against persistently low inflation and periodic deflation, or falling prices, for more than two decades, mostly without success. In the first quarter of 2020, Japan’s inflation rate was running at an anemic 0.7%. It slid into deflationary territory in the last quarter of 2020 and has remained there since: Consumer prices in the third quarter of this year were 0.2% below their level in the third quarter of 2020.
A few other countries have departed from the general dip-and-surge pattern. In Iceland and Russia, for instance, inflation has risen steadily throughout the pandemic, not just in more recent months.
In Indonesia, inflation fell early on and has remained at low levels. In Mexico, the inflation rate fell slightly during the 2020 lockdown period but returned quickly, hitting 5.8% in the third quarter of 2021, the highest level since the fourth quarter of 2017. And in Saudi Arabia, the pattern was reversed: The inflation rate surged during the height of the pandemic but fell sharply in the most recent quarter, to just 0.4%.
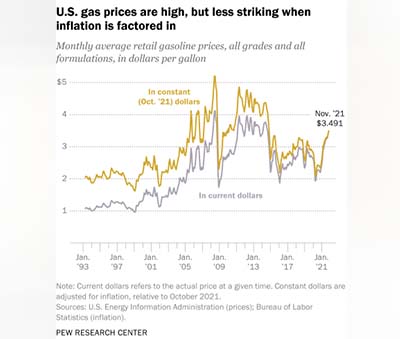 Also, the volatility of gas prices means they can go down as sharply and as suddenly as they go up. In the spring of 2020, as the
  Where you buy gas also matters. Much of the U.S. petroleum industry is concentrated along the Gulf Coast, making it perhaps unsurprising that gas tends to be cheapest there. The average price in that region was $3.072 a gallon in late November, and in Texas it was also a hairsbreadth above $3.