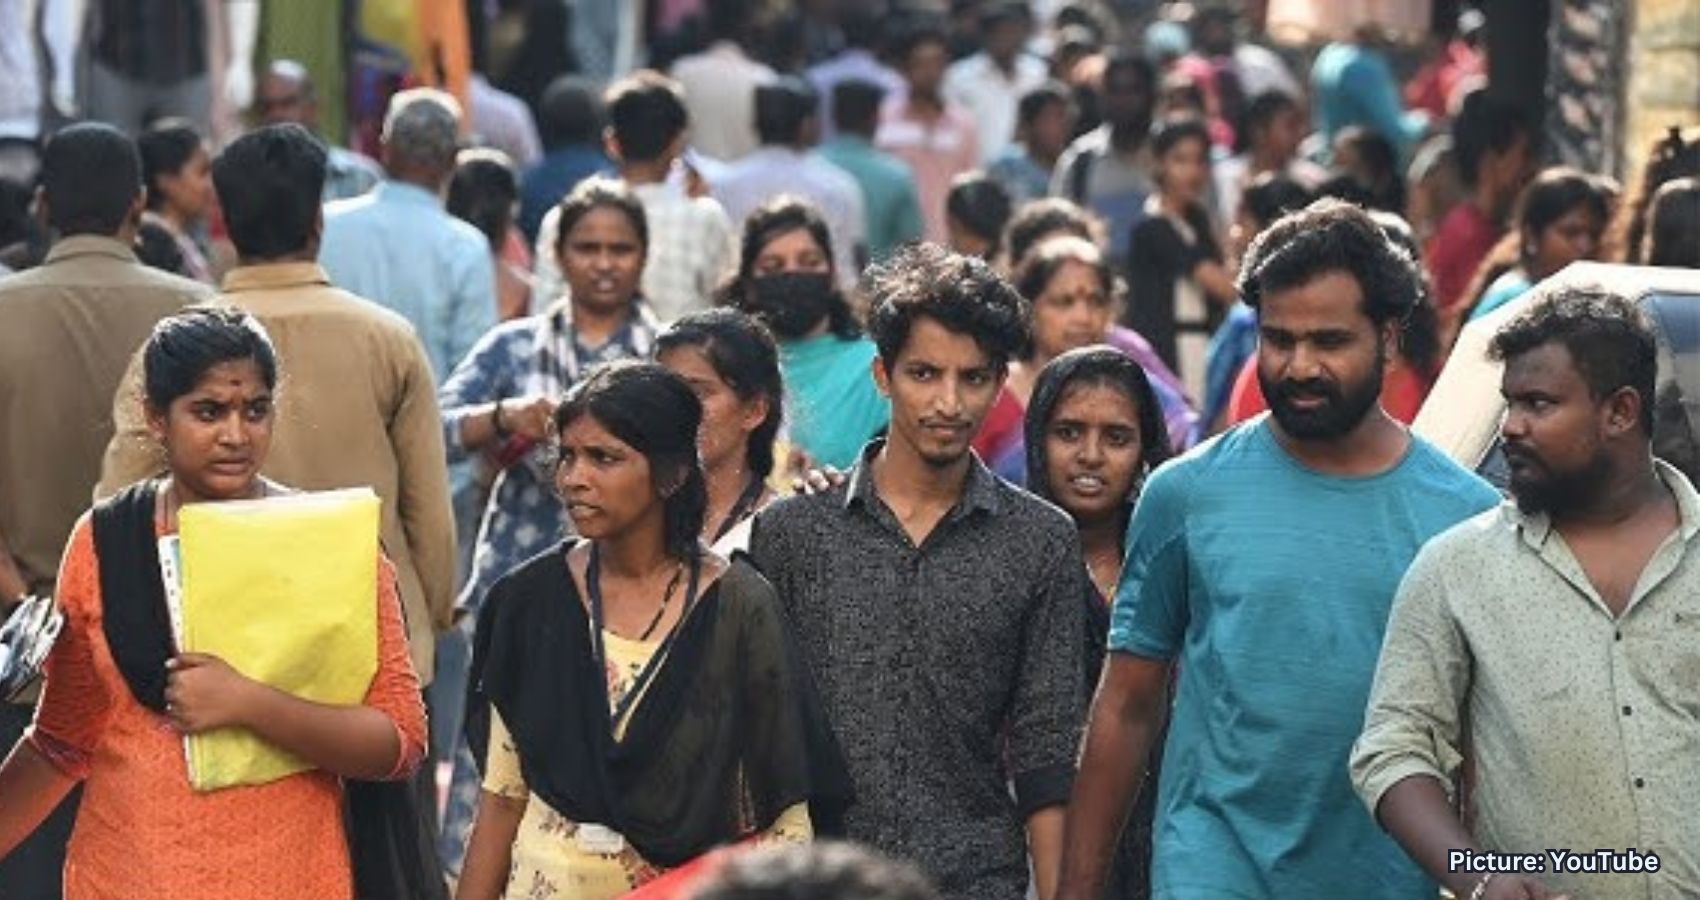
Over the past twenty years, the Indian-origin population in the United States has seen a dramatic rise, and today, Indian Americans rank among the highest in terms of education and income within the broader Asian American community.
A new Fact Sheet released on May 1 by the Pew Research Center, a leading U.S.-based think tank, presents the latest data profile on Americans of Indian descent. Drawing from an analysis of U.S. Census data, the report highlights the demographic, linguistic, economic, and social characteristics of Indian Americans. According to Pew’s interpretation of data from the 2021–2023 American Community Survey (ACS), the Indian American population now numbers approximately 5.2 million. Of this total, those who hold U.S. citizenship represent the second-largest group of Asian origin in the country, making up 21 percent of the Asian American population.
The findings provide insight into the dynamic evolution of the Indian American community. The number of people of Indian origin residing in the U.S. rose from 1.8 million in 2000 to 3.1 million in 2023, reflecting a staggering 174 percent growth over a span of nearly two decades. This immense growth underscores the demographic and cultural shift underway within Asian American communities, particularly among Indians.
While the total population of Indian Americans has grown substantially, the proportion of Indian immigrants within the group has slightly declined. In 2000, immigrants made up 73 percent of all Indian-origin individuals in the U.S. That figure has decreased to 66 percent by 2023. However, the absolute number of Indian-born residents has surged, climbing from 1.3 million in 2000 to 3.2 million in 2023.
Another notable point from the analysis is that a significant portion of Indian immigrants have chosen to become U.S. citizens. According to the Pew Research Center, “Within the Indian community, 51 percent are naturalized citizens while 60 percent have lived here for more than 10 years.” This indicates a high degree of long-term settlement and integration among Indians in the United States.
Education continues to be one of the strongest hallmarks of Indian Americans. Pew’s data reveals that “77 percent of Indian Americans aged 25 and older have bachelor’s degrees or advanced degrees.” This figure stands well above the overall rate for Asian Americans, among whom 56 percent have attained similar educational levels. These statistics affirm the long-standing perception of Indian Americans as a highly educated demographic group, with many excelling in technology, science, medicine, academia, and business.
Language proficiency, especially in English, is also prominent within the Indian community. According to the report, “Compared to other Asians, English proficiency is much higher within the Indian community, with 84% of Indians ages 5 and older speaking the language proficiently.” This is noticeably higher than the 74 percent English proficiency rate among all Asian Americans. Additionally, several Indian languages remain commonly spoken at home. As the Pew study notes, “18 percent speak Hindi, 11 percent Telugu, 10 percent Gujarati, and 7 percent Tamil.”
When examining geographic distribution, Indians are spread across the country, but certain states and metropolitan regions stand out. California tops the list, hosting the largest population of Indian Americans with 960,000 residents. Texas follows with 570,000, while New Jersey has 440,000, New York has 390,000, and Illinois houses about 270,000. At the city level, the largest Indian populations are found in major metropolitan areas such as New York City with 710,000 people, Dallas with 270,000, and San Francisco with 260,000.
Indian Americans also continue to outperform other ethnic groups economically. In 2023, the median household income for Indian-headed households reached $151,200, far exceeding the average for Asian-headed households, which stood at $105,600. Personal earnings also reflected this trend. The Pew data found that “individual annual personal earnings of Indian Americans ages 16 and older was $85,300 in 2023,” whereas the broader Asian American group had an average of $52,400.
The religious composition of Indian Americans also presents a diverse spectrum. Hindus form the largest group, accounting for nearly half of all Indian adults in the U.S. According to the Pew analysis, “48 percent of Indian adults are Hindu; 15 percent are Christian, and 15 percent are unaffiliated.” The unaffiliated category includes people who identify as atheist, agnostic, or not aligned with any particular religion.
Lastly, the data also touches upon poverty rates within the community. Despite common assumptions that associate immigrant groups with financial struggles, Indian Americans have relatively low poverty levels. The Pew report states, “Poverty in the Indian community stood at 6 percent compared to 10 percent among Asians.” This further emphasizes the socio-economic strength of this group, who are often employed in skilled professions with stable incomes.
Overall, the Pew Research Center’s updated profile paints a picture of a growing, highly educated, economically prosperous, and culturally diverse Indian American community. Their contributions continue to shape and enrich the broader American landscape across sectors ranging from technology and healthcare to education, finance, and public life.

