
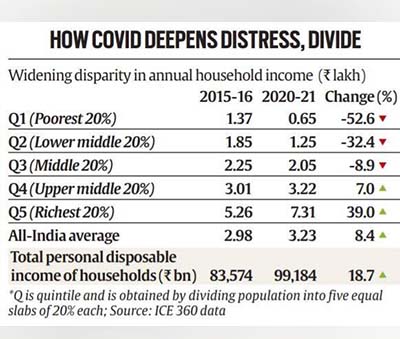
In a trend unprecedented since economic liberalisation, the annual income of the poorest 20% of Indian households, constantly rising since 1995, plunged 53% in the pandemic year 2020-21 from their levels in 2015-16. In the same five-year period, the richest 20% saw their annual household income grow 39% reflecting the sharp contrast Covid’s economic impact has had on the bottom of the pyramid and the top.
This stark K-shaped recovery emerges in the latest round of ICE360 Survey 2021, conducted by People’s Research on India’s Consumer Economy (PRICE), a Mumbai- based think-tank.
The survey, between April and October 2021, covered 200,000 households in the first round and 42,000 households in the second round. It was spread over 120 towns and 800 villages across 100 districts.
While the pandemic brought economic activity to a standstill for at least two quarters in 2020-21 and resulted in a 7.3% contraction in GDP in 2020-21, the survey shows that the pandemic hit the urban poor most and eroded their household income.
Splitting the population across five categories based on income, the survey shows that while the poorest 20% (first quintile) witnessed the biggest erosion of 53%, the second lowest quintile (lower middle category), too, witnessed a decline in their household income of 32% in the same period. While the quantum of erosion reduced to 9% for those in the middle income category, the top two quintiles — upper middle (20%) and richest (20%)— saw their household income rise by 7% and 39% respectively.
The survey shows that the richest 20% of households have, on average, added more income per household and more pooled income as a group in the past five years than in any five-year period earlier since liberalisation. Exactly the opposite has happened for the poorest 20% of households — on average, they have never actually seen a decrease in household income since 1995. Yet, in 2021, in a huge knockout punch caused by Covid, they earned half as much as they did in 2016.
How disruptive this distress has been for those at the bottom of the pyramid is reinforced by the fact that in the previous 11-year period between 2005 and 2016, while the household income of the richest 20% grew by 34%, the poorest 20% saw their household income surge by 183% at an average annual growth rate of 9.9%.
Coming in the run-up to the Budget, the task for the Government is cut out.
“As the Finance Minister is finalising her budget proposals for 2022-23 to give shape to the roadmap for economic revival of the country,” said Rajesh Shukla, MD and CEO, PRICE, “we need a K-shaped policy too that addresses the two ends of the spectrum and a lot more thinking on how to build the bridge between the two.”
Opinion |P Chidambaram writes: No political price yet
This couldn’t be more timely. Said PRICE founder and one of the authors of the survey Rama Bijapurkar. “Or else, we are back to a tale of two Indias, a narrative we thought we were rapidly getting rid of. The good news is that we have built a far more efficient welfare state for the disbursal of benefit be it DBT or vaccination for all.”
The survey showed that while the richest 20% accounted for 50.2% of the total household income in 1995, their share has jumped to 56.3% in 2021. On the other hand, the share of the poorest 20% dropped from 5.9% to 3.3% in the same period.
As for India Inc, it has been in a better position to weather the disruption. The pandemic accelerated further formalisation of the economy with large companies benefitting at the cost of smaller ones. The survey also shows that while job losses were quite evident among Small and Medium Enterprises in the casual labour segment, large companies did not witness much of that.
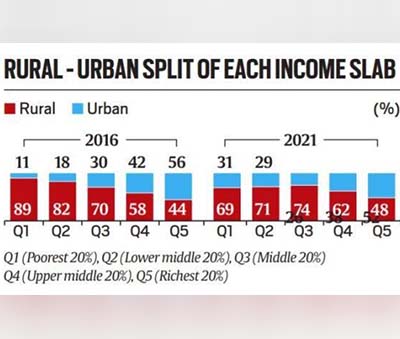
Even among the poorest 20 per cent, those in urban areas got more impacted than their rural counterparts as the first wave of Covid and the lockdown led to stringent curbs on economic activity in urban areas. This resulted in job losses and loss of income for the casual labour, petty traders household workers.
Data shows that there has been a rise in the share of poor in cities. While 90 per cent of the poorest 20 per cent in 2016, lived in rural India, that number had dropped to 70 per cent in 2021. On the other hand the share of poorest 20 per cent in urban areas has gone up from around 10 per cent to 30 per cent now.
“The data reflects that the casual labour, petty trader, household workers among others in Tier 1 and Tier 2 cities got hit most by the pandemic. During the survey we also noticed that while in rural areas people in lower middle income category (Q2) have moved to middle income category (Q3), in the urban areas the shift has been downwards from Q3 to Q2. In fact, the rise in poverty level of urban poor has pulled down the household income of the entire category down,” said Shukla.
“The elephant in the room is investment,” said Bijapurkar. “Inspiring confidence through long-term policy stability and improving ease of doing business should make the tide rise again and sweep small business and individuals up along with it. Most big companies are doing well and don’t need more help but we need to work the economy for the bottom half.”